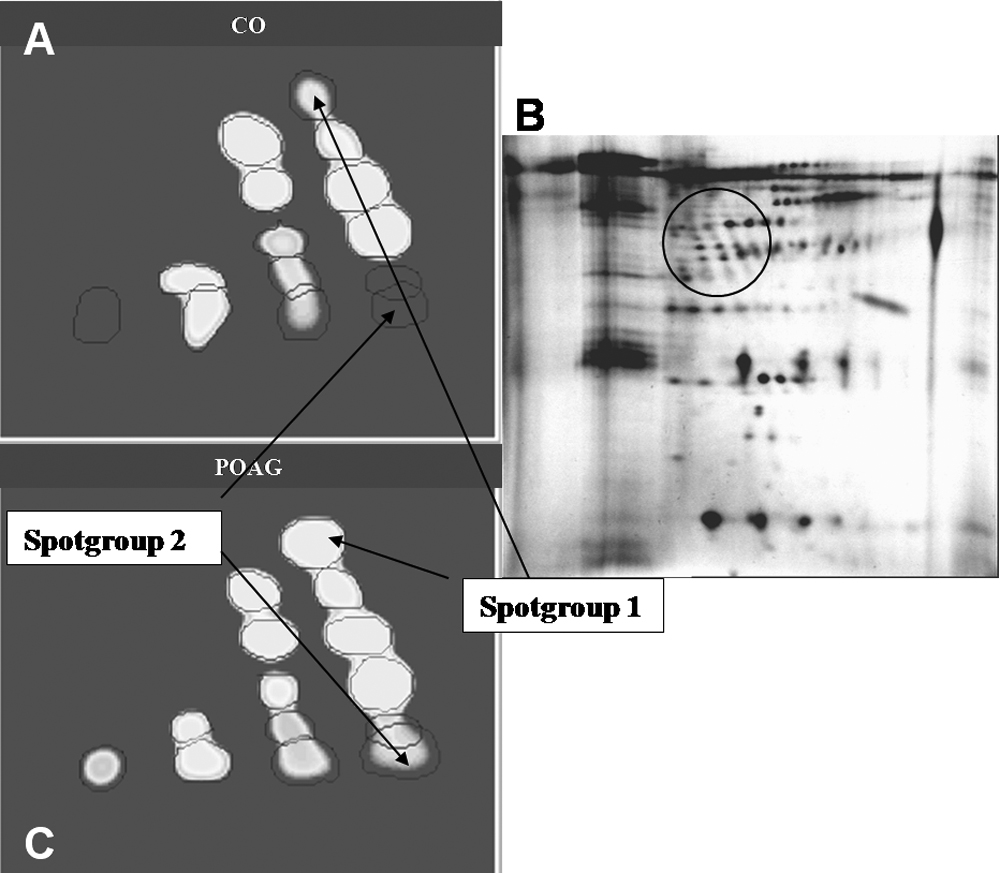
Figure 7. Comparison of spot groups 1 and
2 (molecular weight 37.4–49.4 kDa, IP: 5.7–5.9). A shows a
synthetic gel of all aqueous humor control samples (CO), and C
shows a synthetic gel of all aqueous samples from patients with primary
open-angle glaucoma (POAG). B shows a “real” 2D gel of an
aqueous humor sample from a patient with primary open-angle glaucoma.
The circle points out spot groups 1 and 2 on this gel. Different
staining intensities due to the difference in protein concentration can
be seen for spot group 1 and 2 on the two artificial gels.