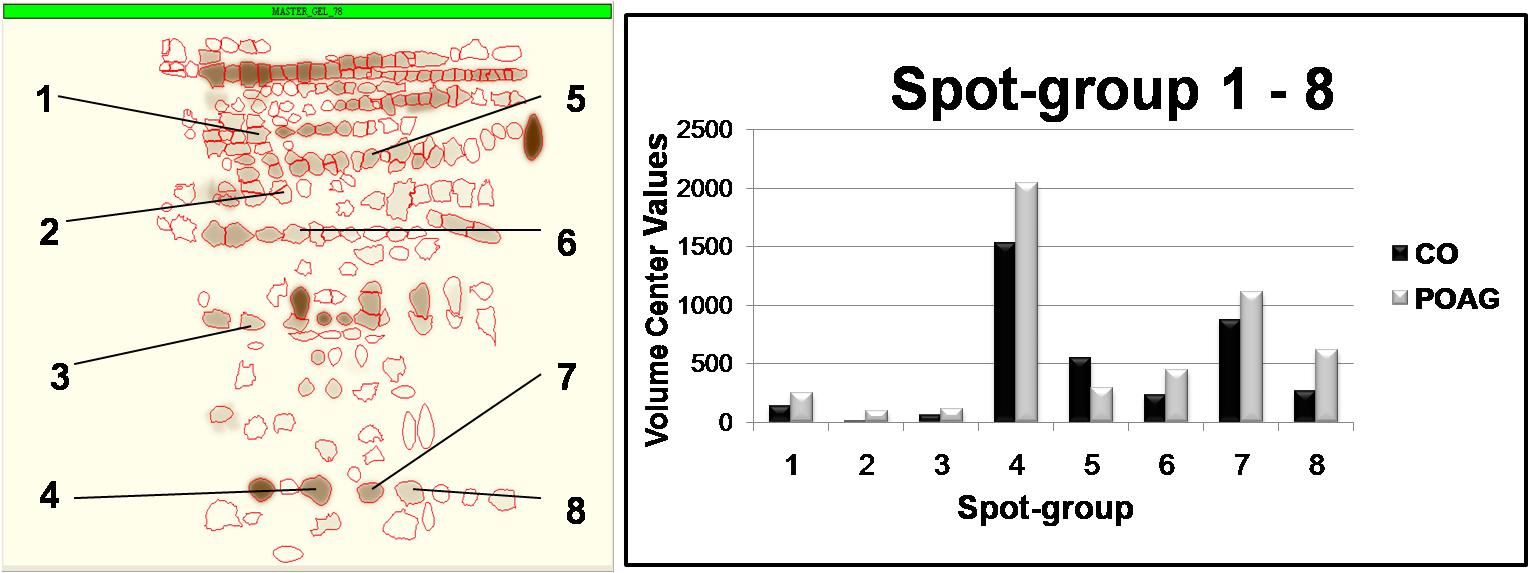
Figure 6. This graph shows the
localization of spot groups 1-8 in a “master-gel” on the left side and
the mean intensities of the control (CO) and primary open-angle
glaucoma (POAG) groups on the right side. The spot groups 4, 7, and 8
existed in all samples and carried a higher amount of protein than all
other spot groups especially in the POAG group. The only higher mean
volume in controls can be seen in spot group 5.