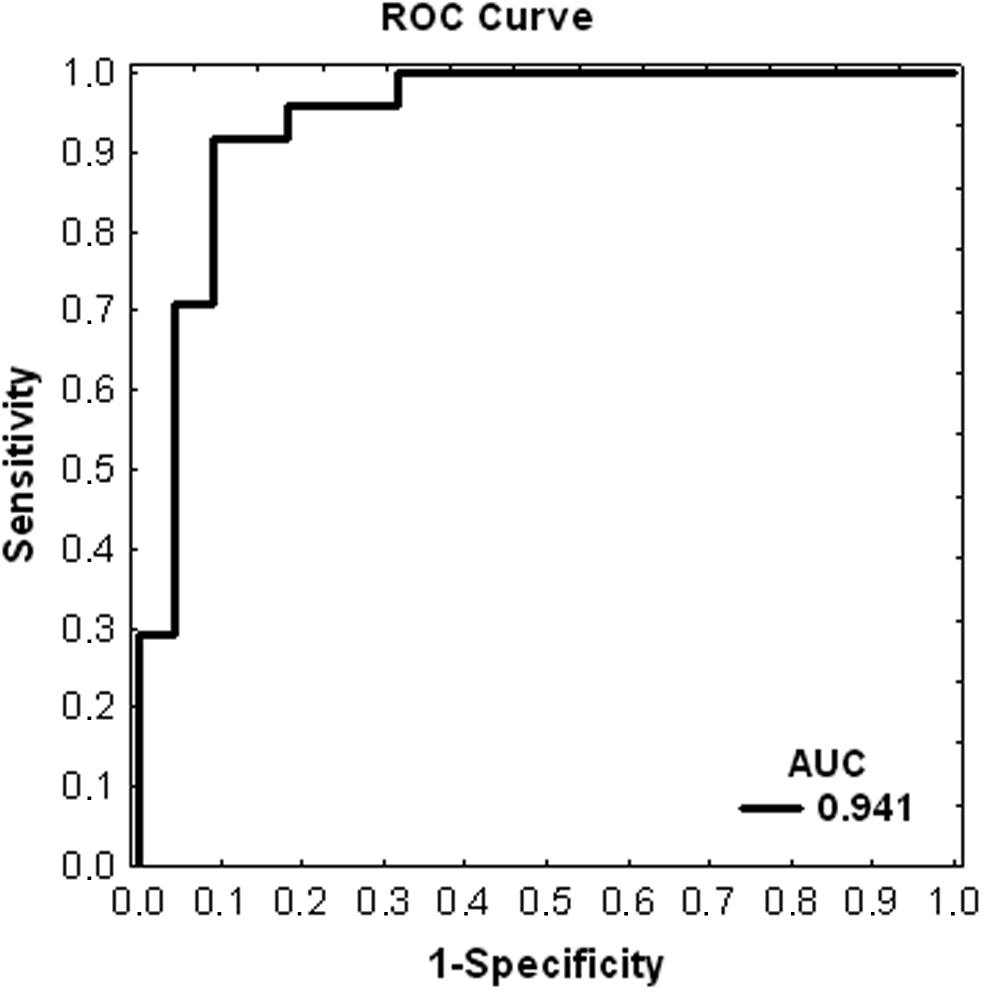
Figure 5. The receiver operating
characteristic curve for the diagnosis of glaucoma through complex
protein patterns. The groups were discriminated with a sensitivity of
90% and a specificity of 87%. The calculation of the area under the
curve (AUC) led to an r value of 0.94. The x-axis shows 1-specificity
and the y-axis the sensitivity.