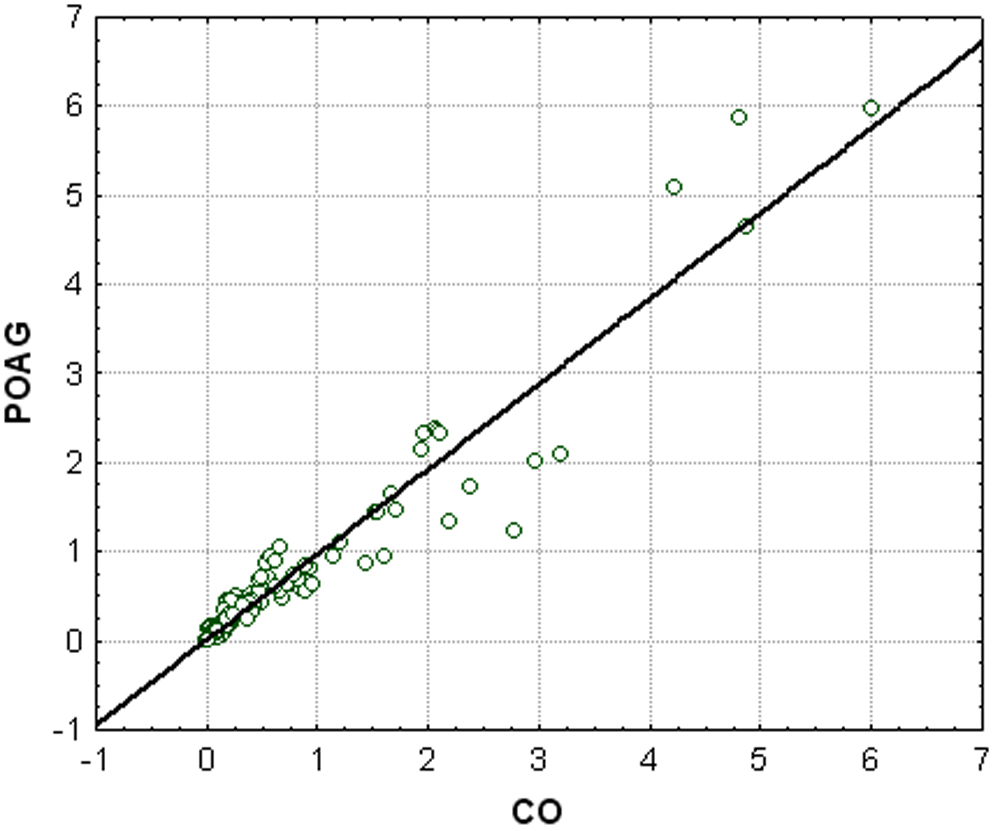
Figure 4. This scatter-plot demonstrates
the correlation of the intensities of protein patterns between patients
with primary open-angle glaucoma (POAG) and controls (CO). Spots above
the line represent protein peaks with higher intensities in the POAG
group (using SELDI-TOF analysis), dots below the line are peaks with
lower intensity in the POAG group. This graph shows that up- and
downregulated proteins were detected in aqueous humor of POAG patients.