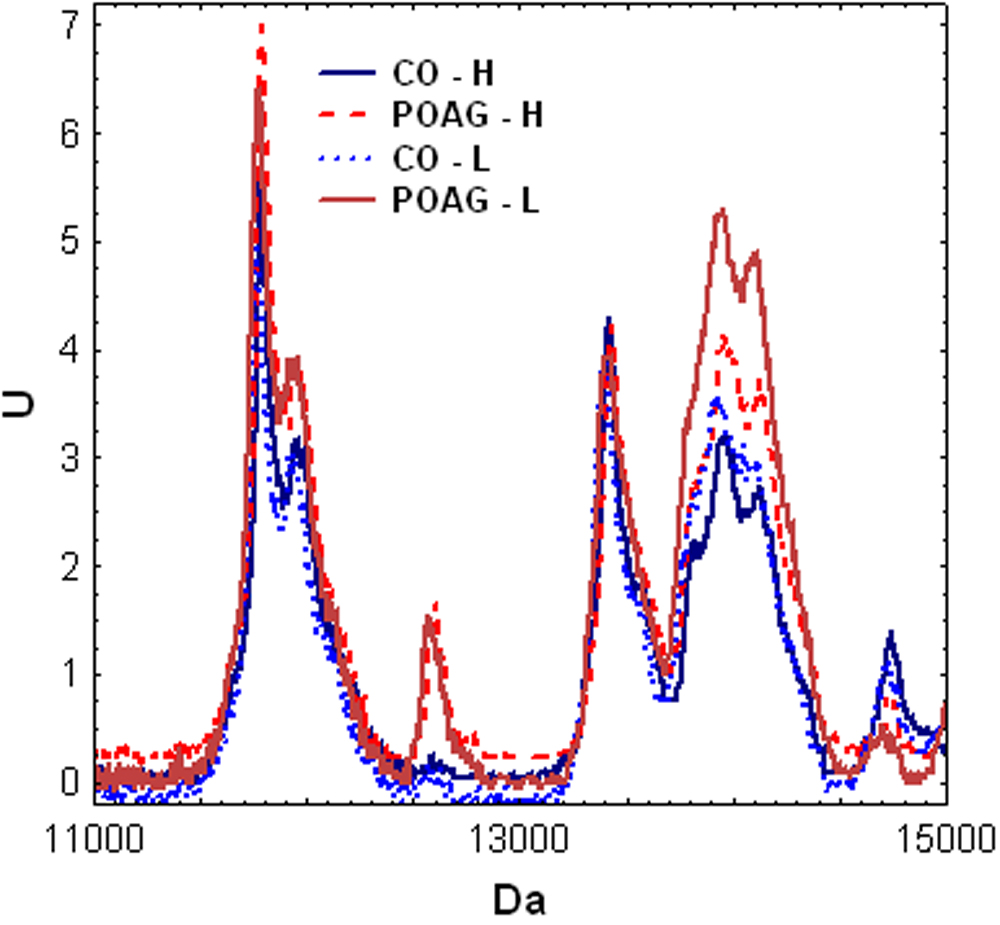
Figure 3. Group average intensities of
mass spectrometry measurements for both CO and POAG groups and
different laser energies. The intensities of the SELDI-TOF readings (U)
were plotted against the molecular weight (in Da). All measurements on
CM10 chips are shown in this graph. H: high, L: low energy. In several
regions on this graph a higher protein intensity can be seen in the
POAG group.