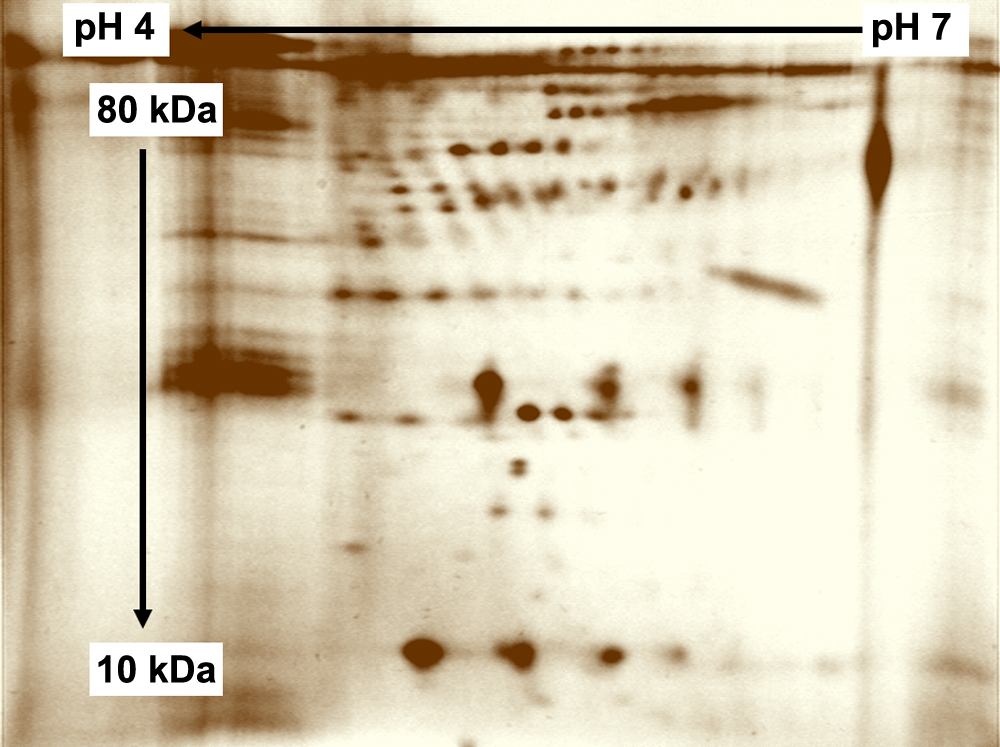
Figure 1. Example of a two-dimensional gel
with Oakley silver staining of aqueous humor sample from a POAG
patient. The x-axis shows the first dimension (separation by
isoelectric point), and the y-axis shows the second dimension
(separation by molecular weight). The dark spots represent stained
proteins.