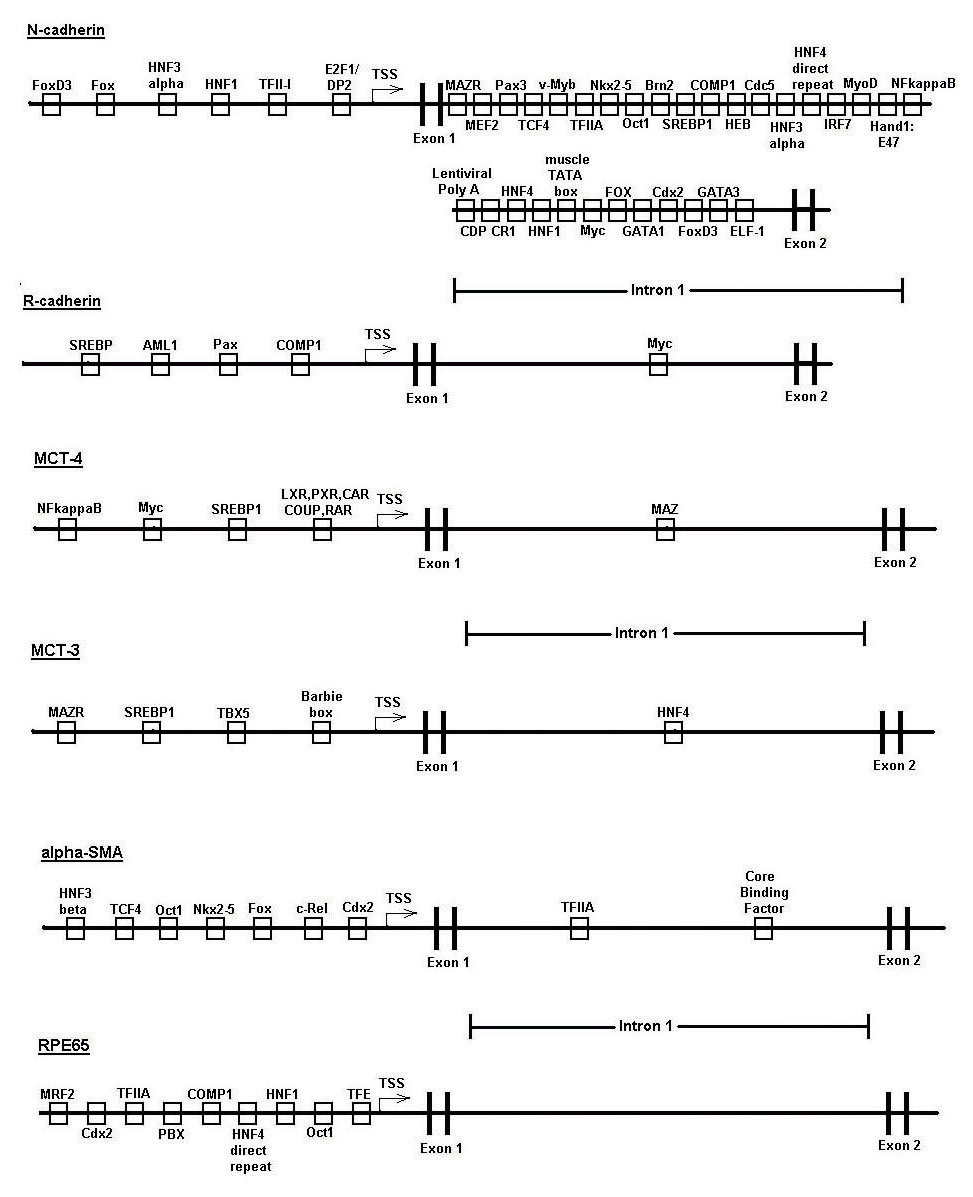
Figure 9. Gene regulatory region models
for specific reciprocally-regulated gene pairs. Models for the paired
genes that are reciprocally regulated during EMT of RPE cells models
including N- and R-cadherin (A), α-SMA and RPE-65 (B),
and MCT-3 and −4 (C). Models were constructed by including only
those TREs that are over-represented in both the human and chicken, as
well as either the mouse or rat, PAINT analysis.