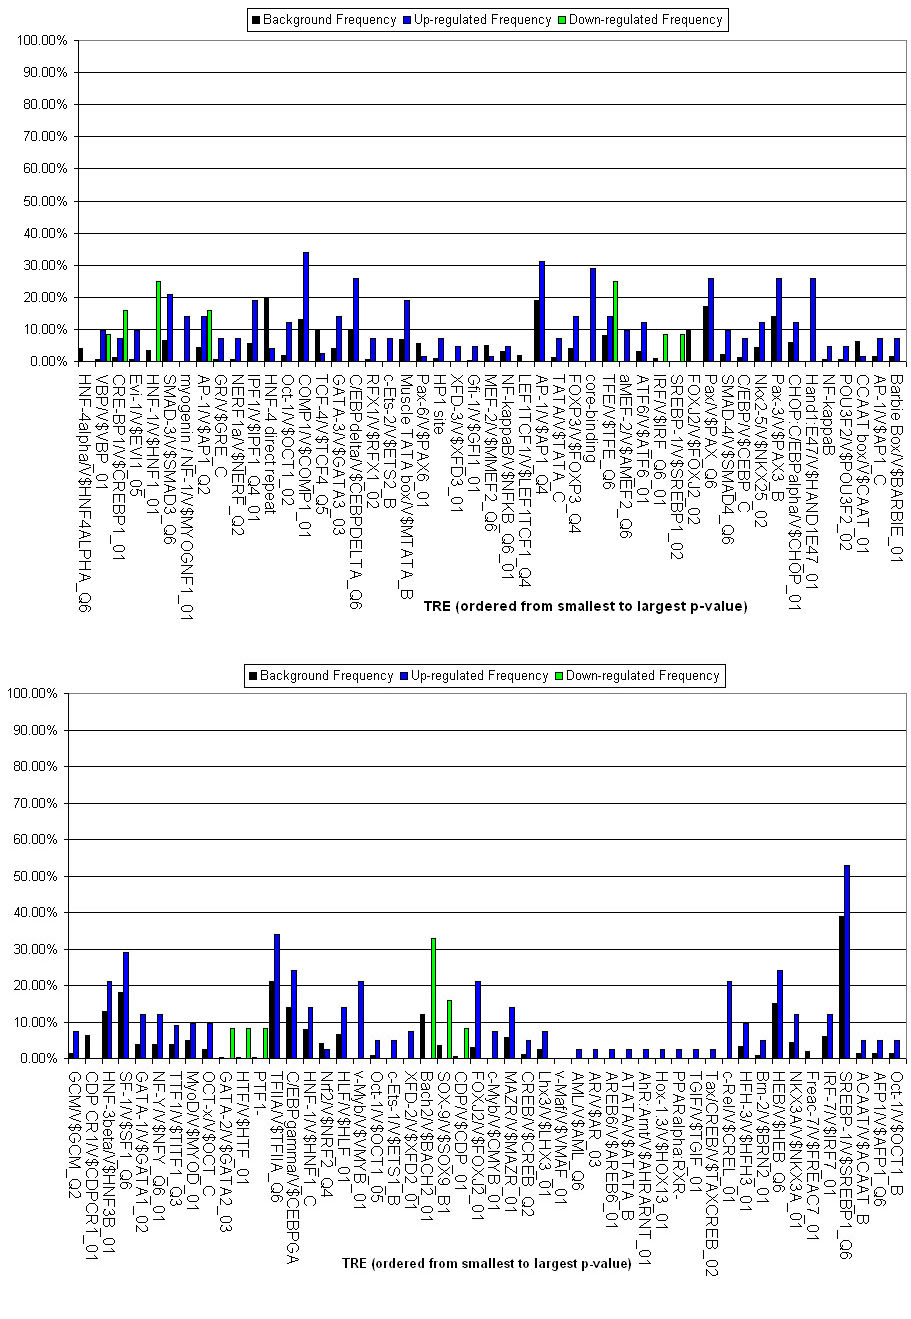
Figure 6. Frequency analysis of
transcription response element representation in human first intron
regions. Frequency of occurrence of each transcription response element
(TRE) in the human gene first intron regions was determined from the
PAINT analysis as described in Methods. The y-axis indicates the
frequency of each TRE among the upregulated (blue) or down-regulated
(green) gene clusters as well as among the full background gene set
(black). The x-axis indicates the over-represented TREs, ordered by
increasing p-value. Corresponding frequency analyses for mouse, rat and
chick first intron regions are shown in
Appendix 27
through
Appendix
29.