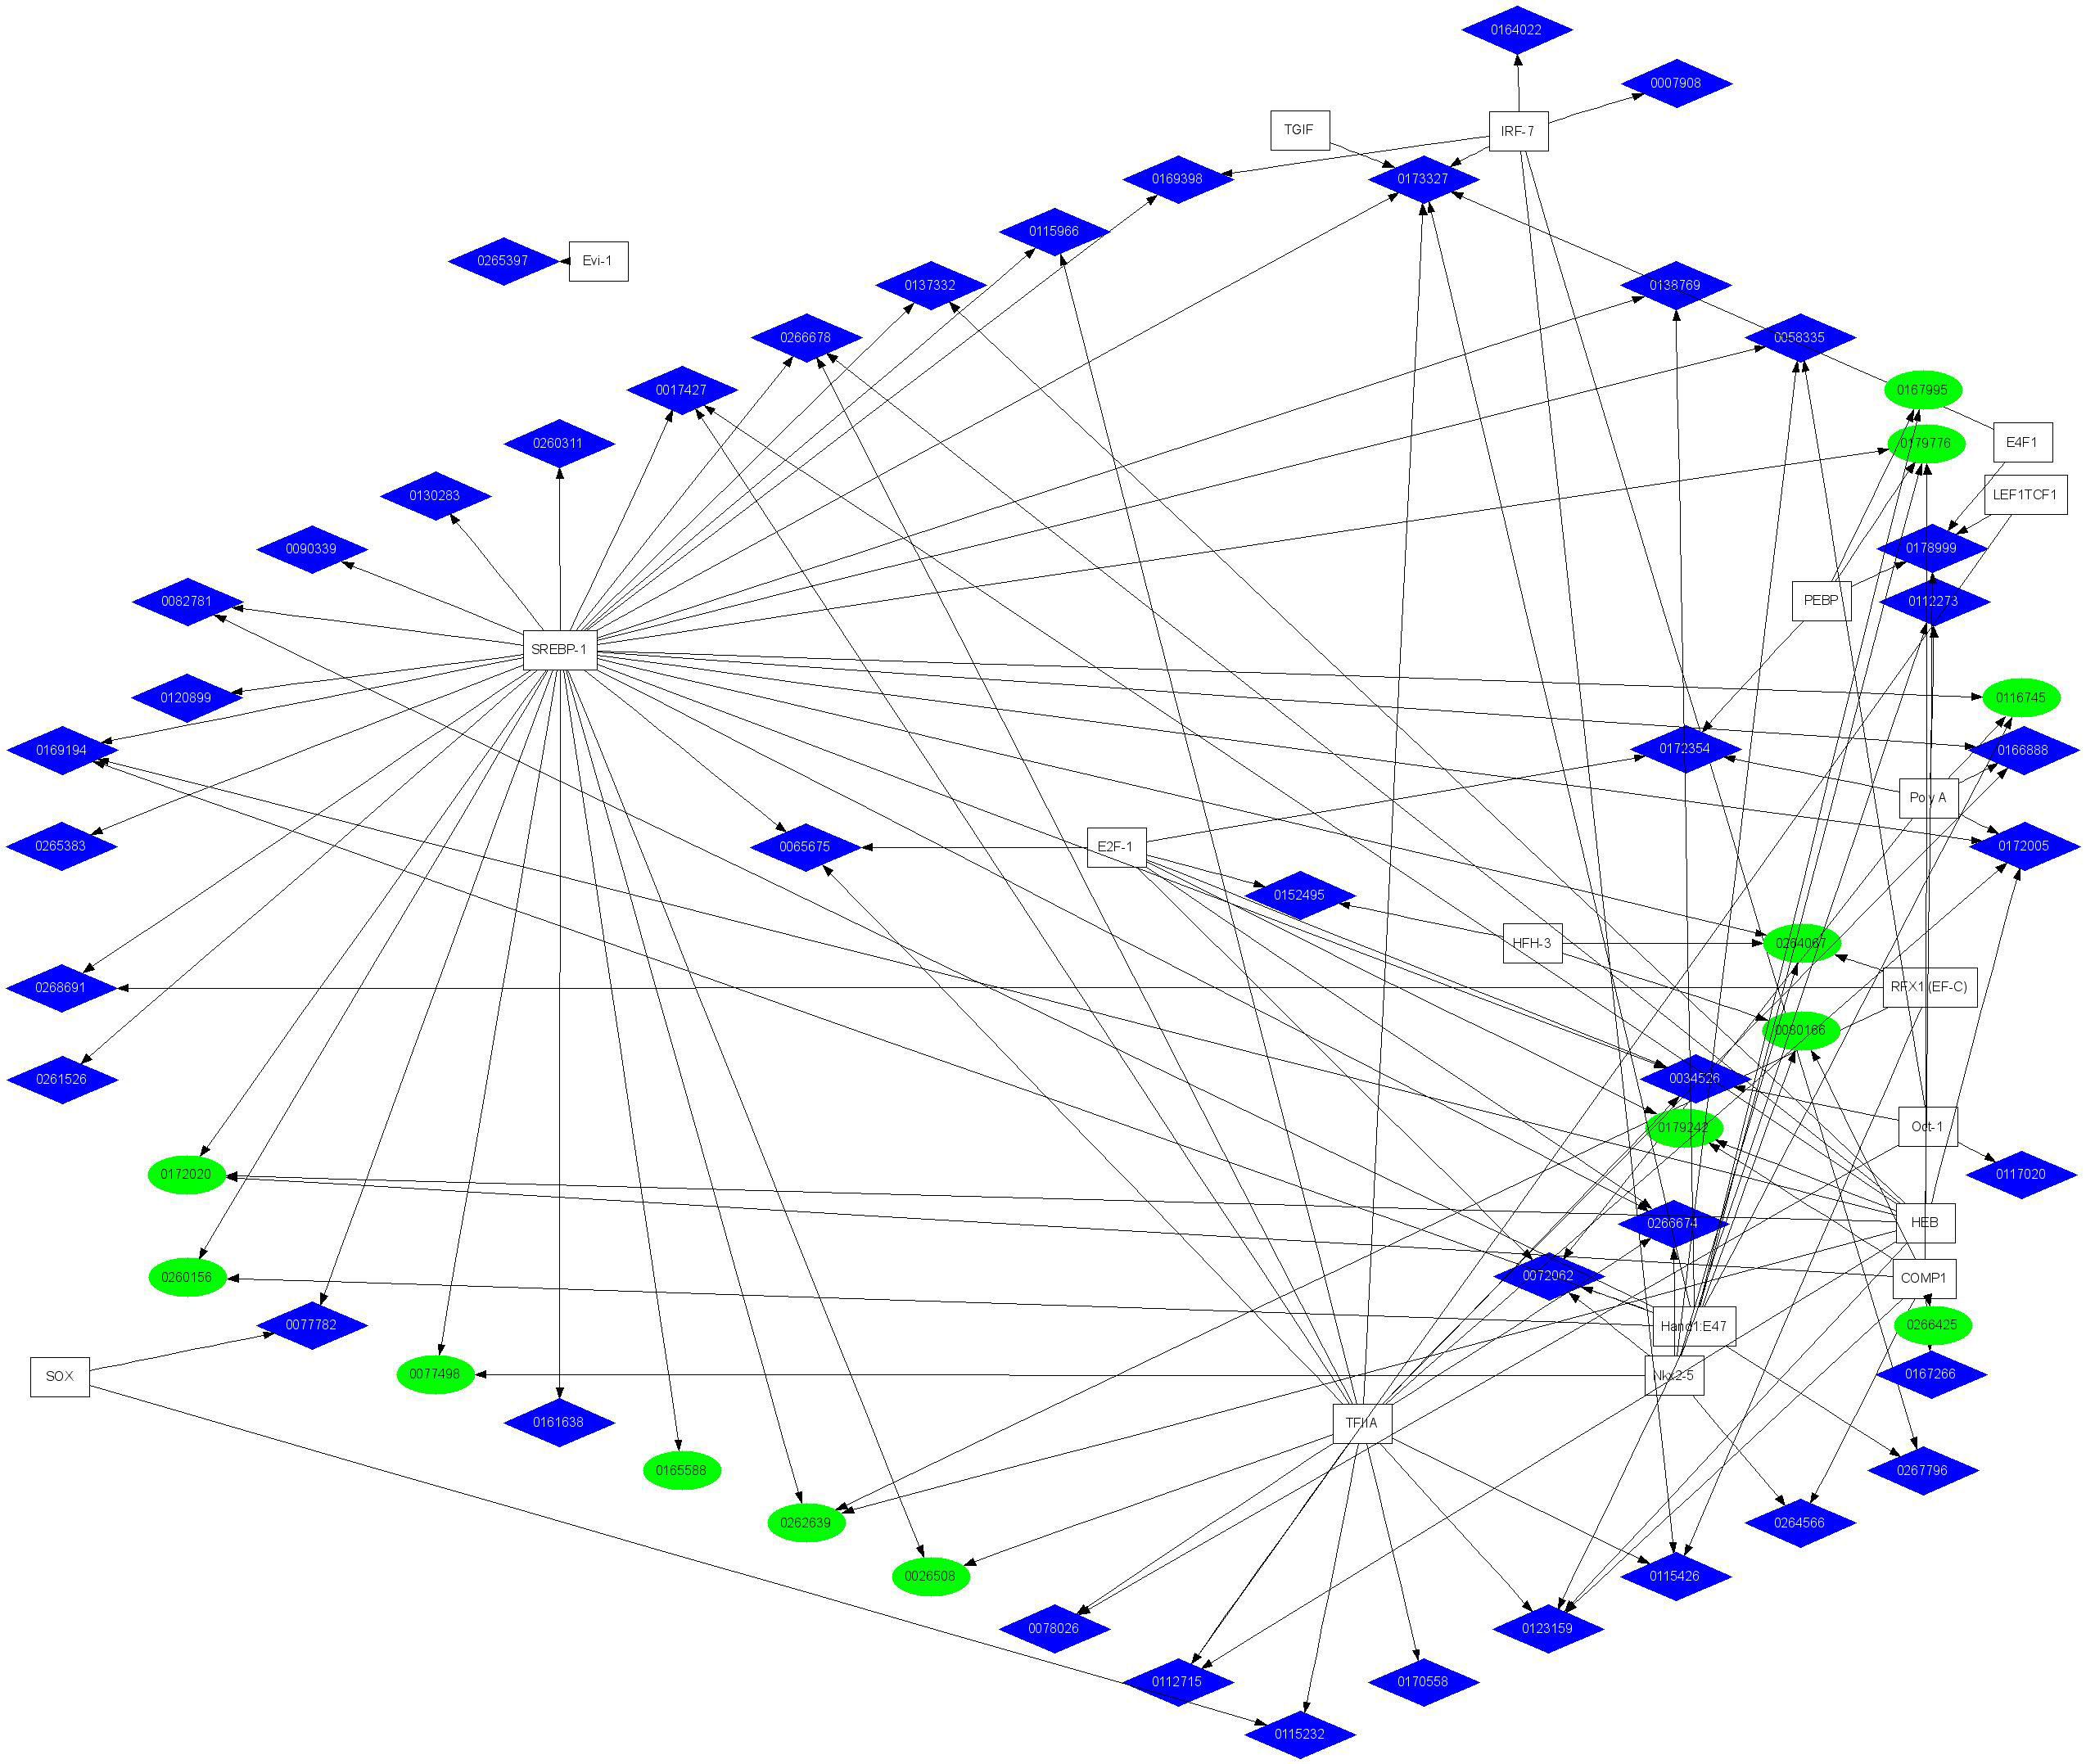
Figure 3. Transcriptional regulatory
network diagram for transcription response element associated with
human promoter regions. The graphical representation was derived using
GraphViz as described in Methods. The ellipses and diamonds represent
individual genes divided into upregulated (blue) and down-regulated
(green) clusters. The boxes represent TREs, with arrows indicating
gene-TRE associations. Corresponding network diagrams for mouse, rat
and chick promoter regions are shown in
Appendix 18
through
Appendix
20.