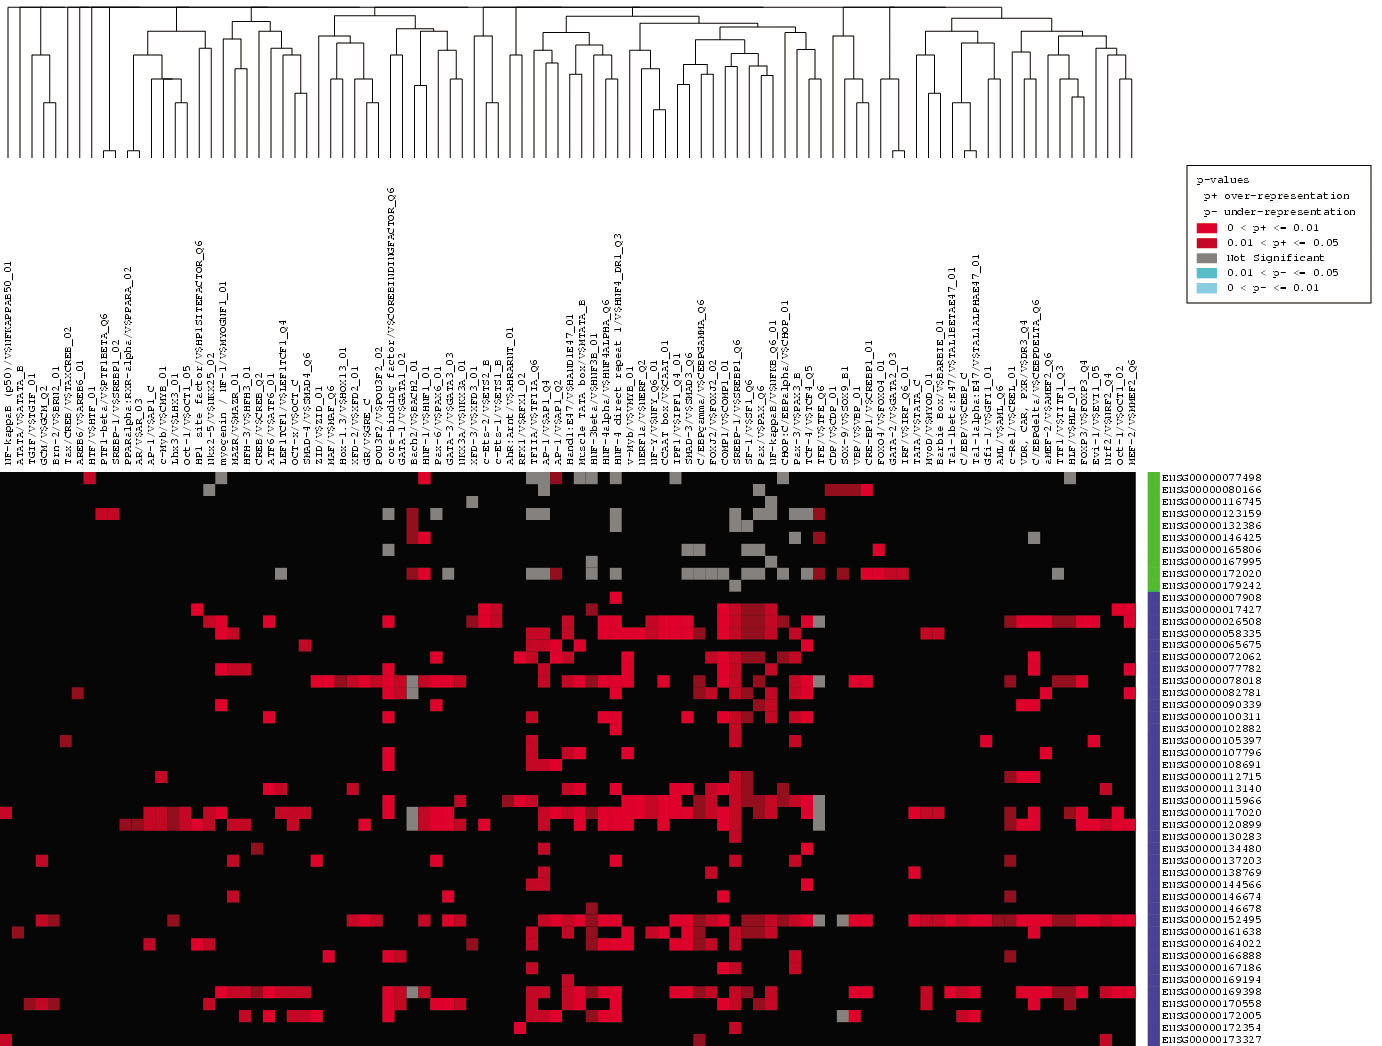
Figure 2. Candidate interaction matrix for
statistically enriched transcription response elements from promoter
analysis and interaction network toolset analysis of human gene first
introns. The retinal pigment epithelium (RPE) gene set was analyzed by
promoter analysis and interaction network toolset (PAINT) and a graphic
candidate interaction matrix (CIM) was generated as described in
Methods. The y-axis lists the Ensembl Gene identifiers for each gene
and the x-axis lists the TRANSFAC identifiers for each transcription
response element (TRE) found at least once in the first intron region.
Genes listed along the y-axis are divided into two clusters that are
either upregulated (blue) or down-regulated (green) during EMT of RPE
cells. TREs listed along the x-axis are clustered according to related
occurrence pattern calculated using Jaccard's coefficient. The elements
within the matrix are color-coded based on the p-value of each TRE
found in the regulatory regions of the genes. A red dot represents a
TRE that is statistically significant and therefore over-represented in
our gene set, while a blue dot signifies an under-represented TRE and a
gray dot stands for a TRE with no statistical significance in our gene
list. This figure represents the subset of enriched TREs for the human
genome; the full CIMs for human and other genomes analyzed are shown in
Appendix 14
through
Appendix
17.