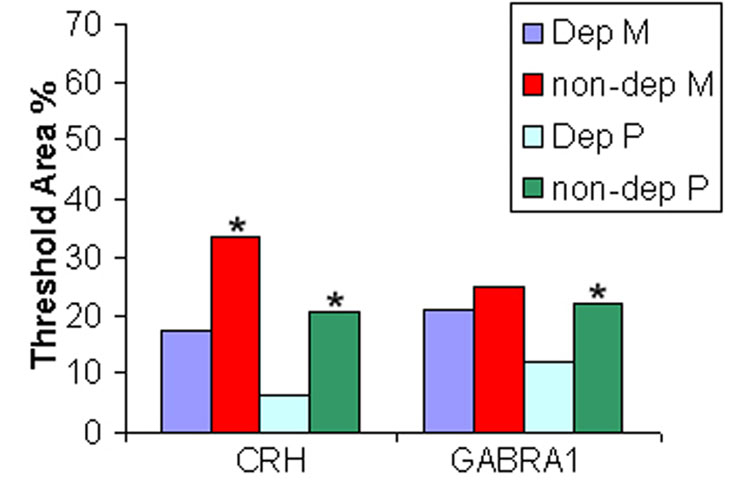
Figure 8. Quantification for in situ
hybridization of CRH and GABRA1 in deprived LGN. Percent threshold area
represents the percentage of area in a given layer that contains a
positive in situ hybridization signal. The purple colored graph bar is
Dep M which indicates deprived magnocellular layers. The red colored
graph bar is non-dep M which indicates nondeprived magnocellular
layers. The light blue colored graph bar is Dep P which indicates
deprived parvocellular layers. The green colored graph bar is non-dep P
which indicates nondeprived parvocellular layers. The asterisk Denotes
a p<0.05 for deprived layers compared to nondeprived layers.