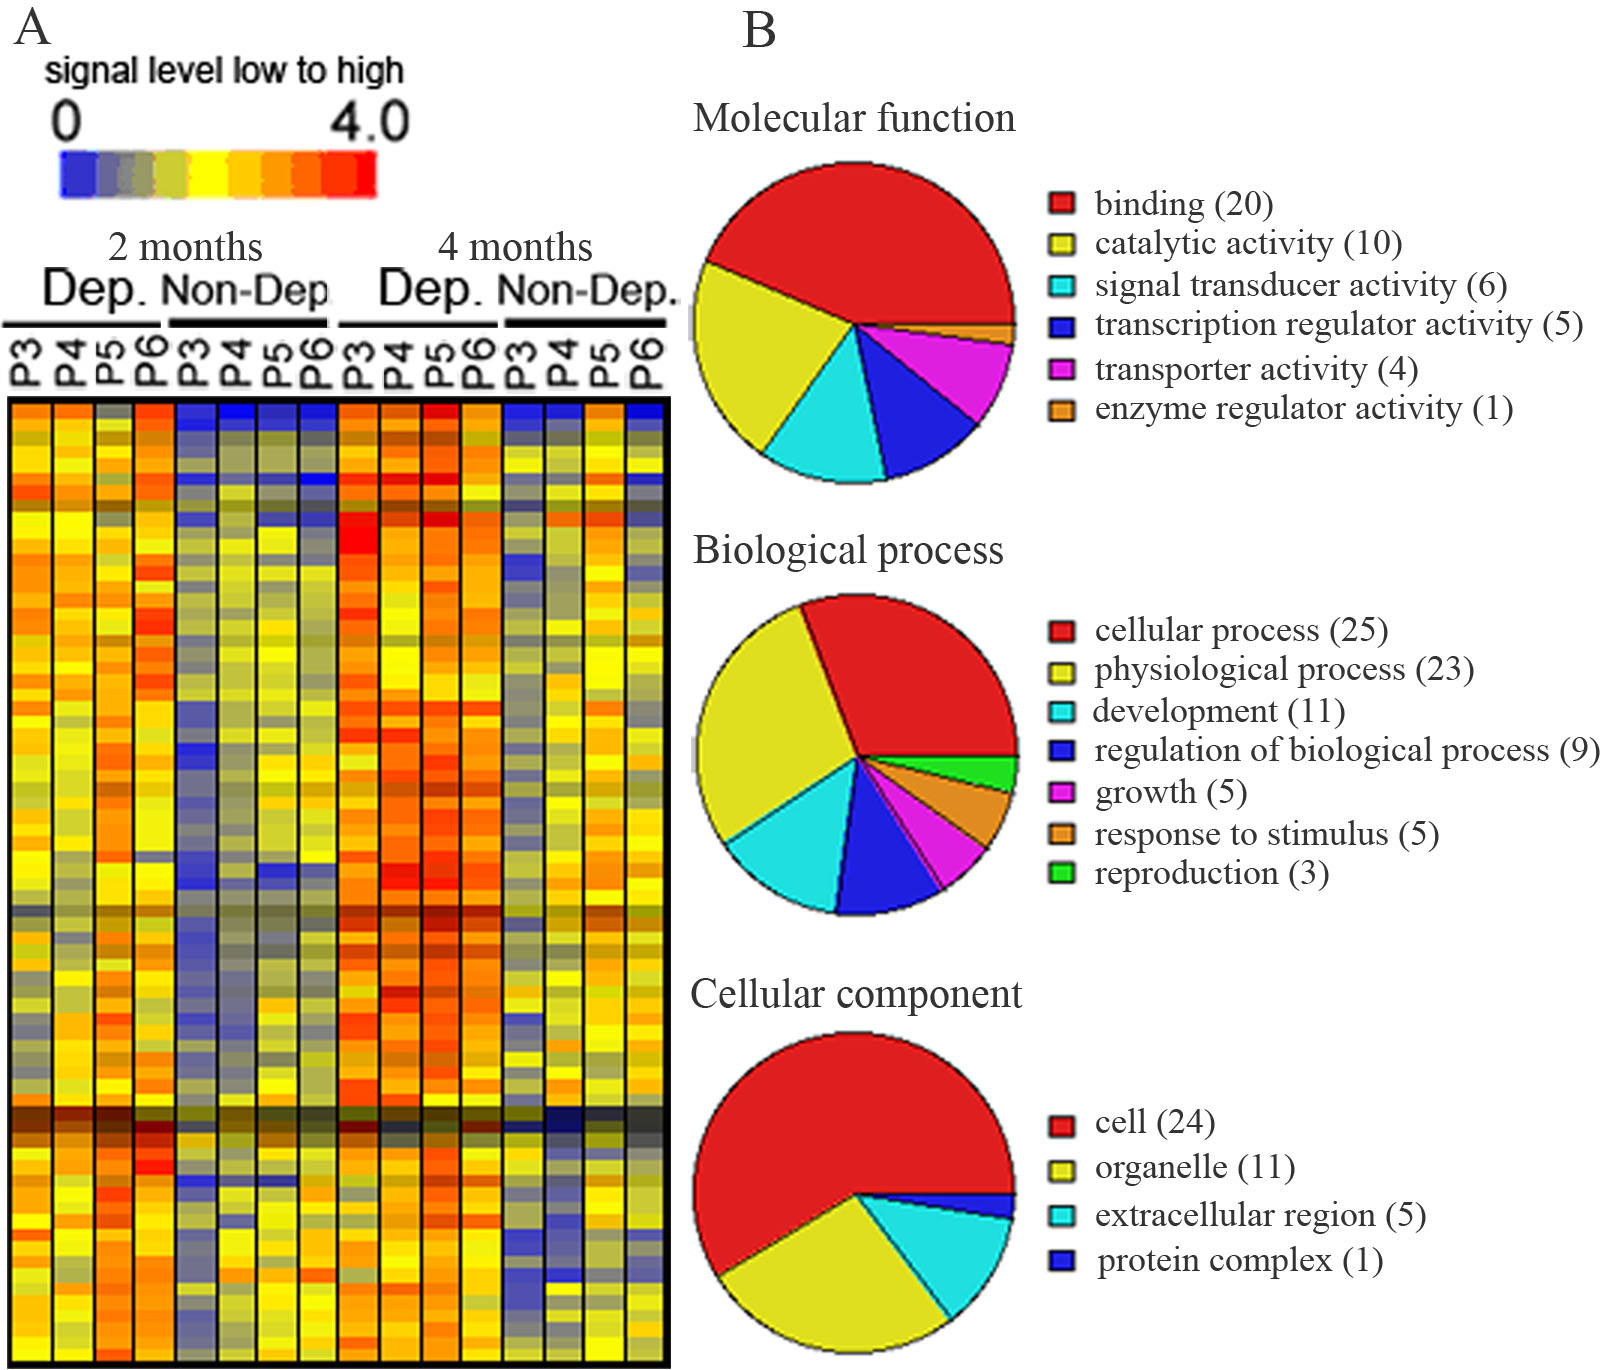
Figure 3. Transcripts that were
upregulated in deprived parvocellular layers as compared with
non-deprived layers of 2 or 4 months after monocular vision
deprivation. A: Hierarchical dendogran analysis displayed genes
upregulated (orange to red color) in deprived layers as compared with
non-deprived layers. B: Pie chart displayed functional
categorization of genes that were upregulated in deprived layers.
Number in parentheses indicated how many genes involved in that
category function. P3-P6 represent parvocellular layer III to VI.
Abbreviations: Dep: deprived layer; Non-Dep: non-deprived layer.2
months or 4 months: 2 or 4 months of monocular vision deprivation.