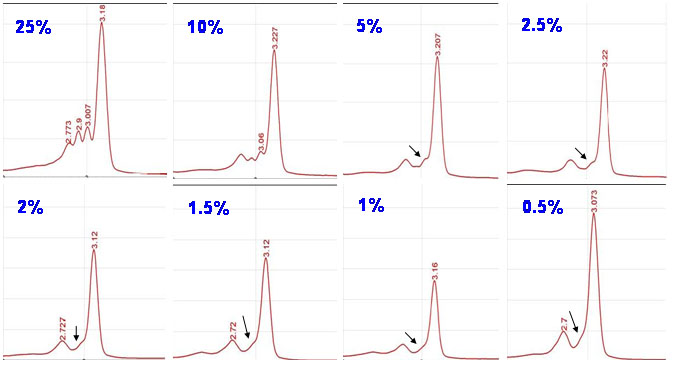
Figure 3. Chromatograms showed by the
analysis of the serial dilutions by the dHPLC. The percentage data
indicate the amount of the carrier DNA present in the dilution. The
double-peak corresponding to the heteroduplexes decreases in size as
the percentage of mutant DNA in the sample gets lower. From the 5% to
the 2% dilution, the double-peak becomes a slight peak (pointed by the
arrows in the figure). Below the 2%, the heteroduplexes could not be
distinguished. These chromatograms revealed that the mutation was
detectable up to the 2% dilution.