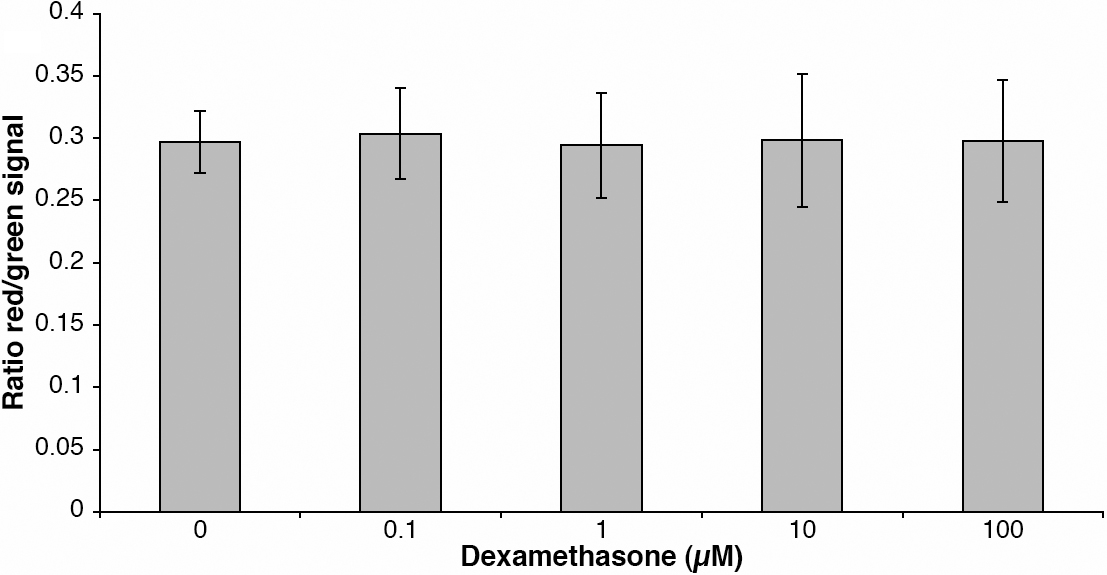
Figure 5. Mitochondrial membrane potential
after dexamethasone exposure. Mitochondrial membrane potential in
dexamethasone-exposed human lens epithelial cells did not differ
significantly from the control group. The experiment was repeated eight
times with identical results. Changes in mitochondrial membrane
potential are expressed as the ratio of red signal (Ex 540 nm, Em 590
nm) to green signal (Ex 485 nm and Em 535 nm). Mean ±SEM are given.