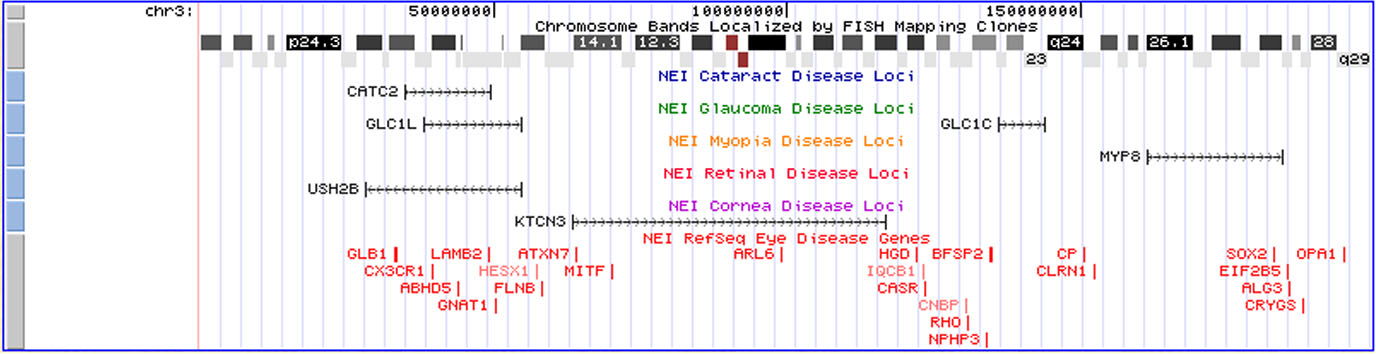
Figure 6. Eye disease genes and candidate
disease tracks. An overview of human chromosome 3 shows the positions
of known eye disease genes and candidate eye disease region tracks
(with gene and expression tracks toggled off). Approximately 200 Mb of
sequence is displayed. The chromosome banding pattern is illustrated
followed by the regions that display positive linkage for various eye
diseases. Displayed below the linkage regions are the genes annotated
by the NEIBank Disease Gene database.