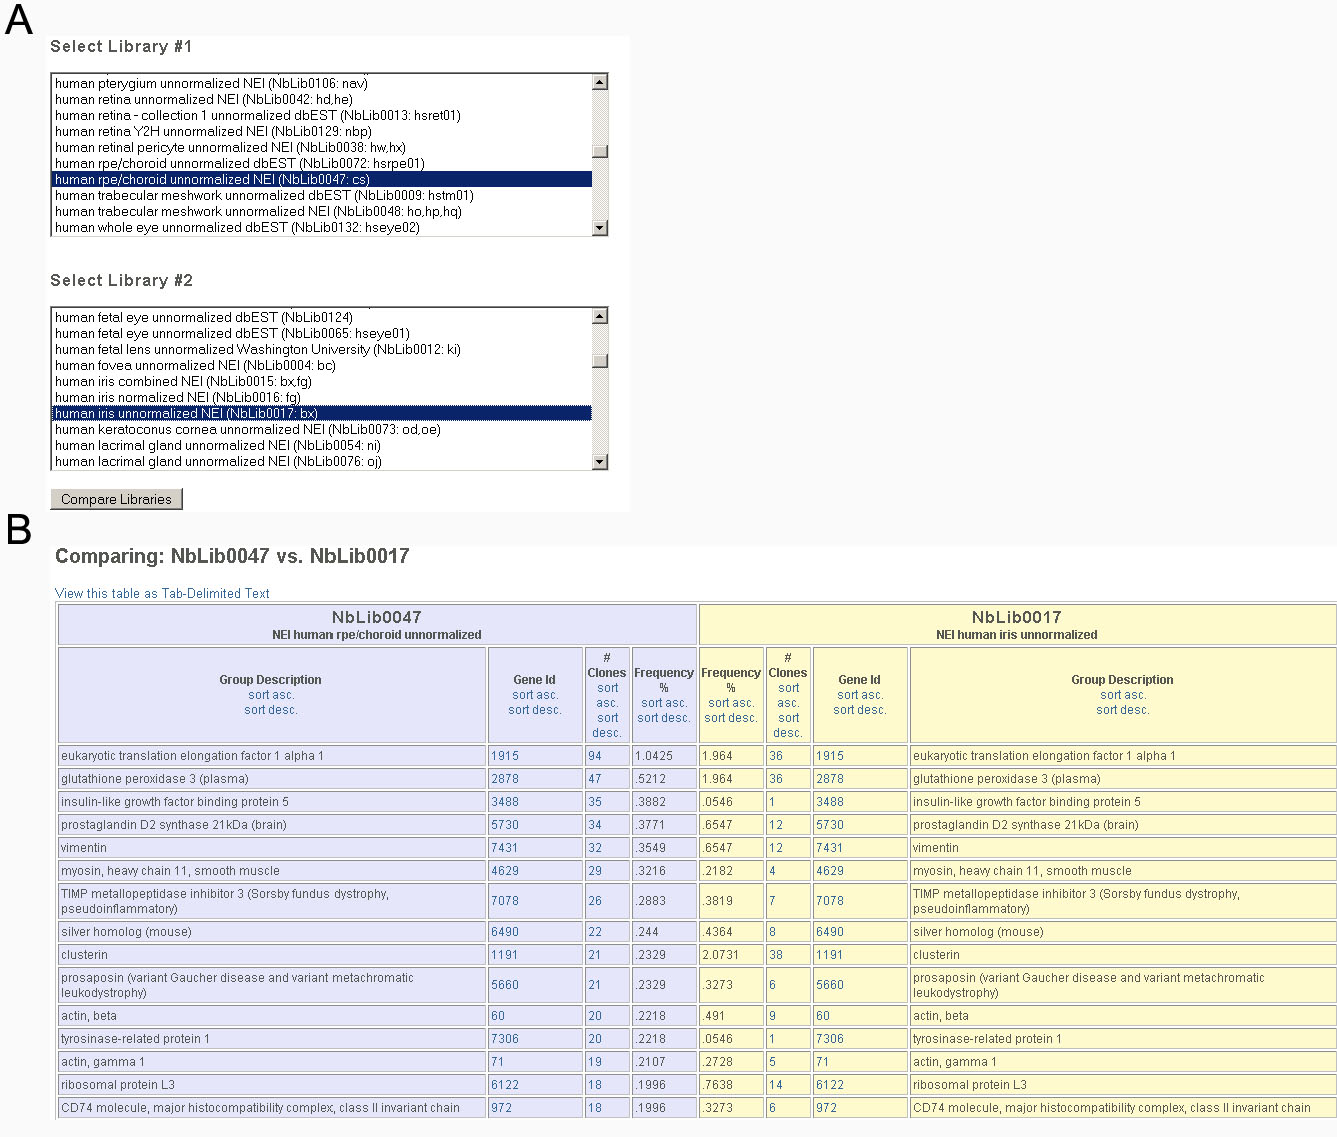
Figure 4. Library comparison. A:
EST data for pairs of cDNA libraries can be selected for comparison. B:
The output lists the genes identified in the first library, ranked by
number and frequency of ESTs, and shows the number and frequency of
ESTs for the same gene in the second library. This provides useful
comparisons for relatively abundant transcripts in unnormalized (native
abundance) cDNA libraries. For the same species (e.g., human retina
versus human retinal pigment epithelium), libraries are compared based
on common Entrez Gene IDs. Different species for which orthologous
GeneIDs are linked through Homologene, can be compared (e.g., human
retina versus mouse retina).