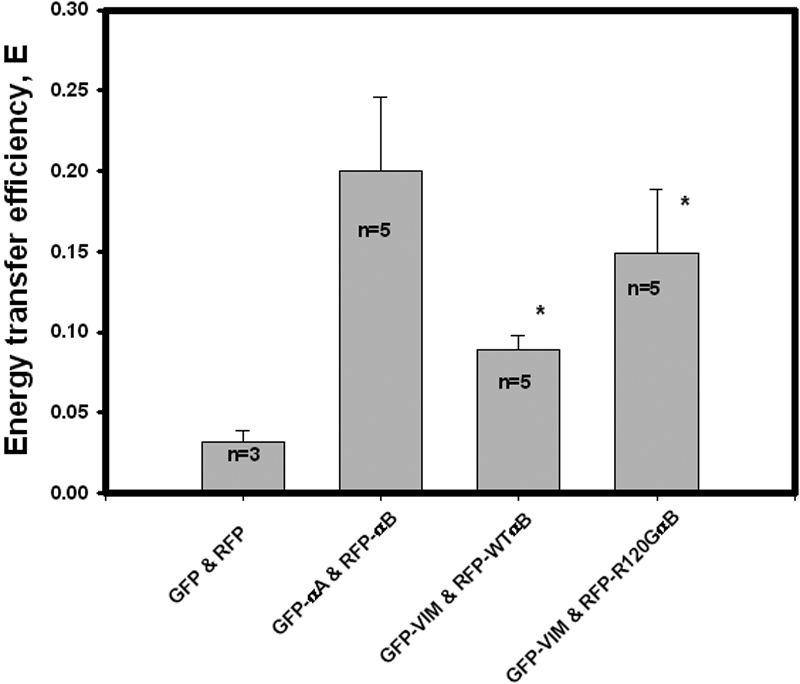
Figure 6. Summary of transfer efficiencies
for various pairs, GFP and RFP, GFP-αA and RFP-αB, GFP-VIM, and
RFP-WTαB and GFP-VIM and RFP-R120G αB. Significant differences in
transfer efficiency were observed among them (ANOVA test, p=0.0013),
and a twofold increase for the pair of GFP-VIM and RFP-R120G αB over
the pair of GFP-VIM and RFP-WTαB (t-test, the asterisk indicates
p=0.02) was also observed. The n inside the bar is the number of cells
photobleached.