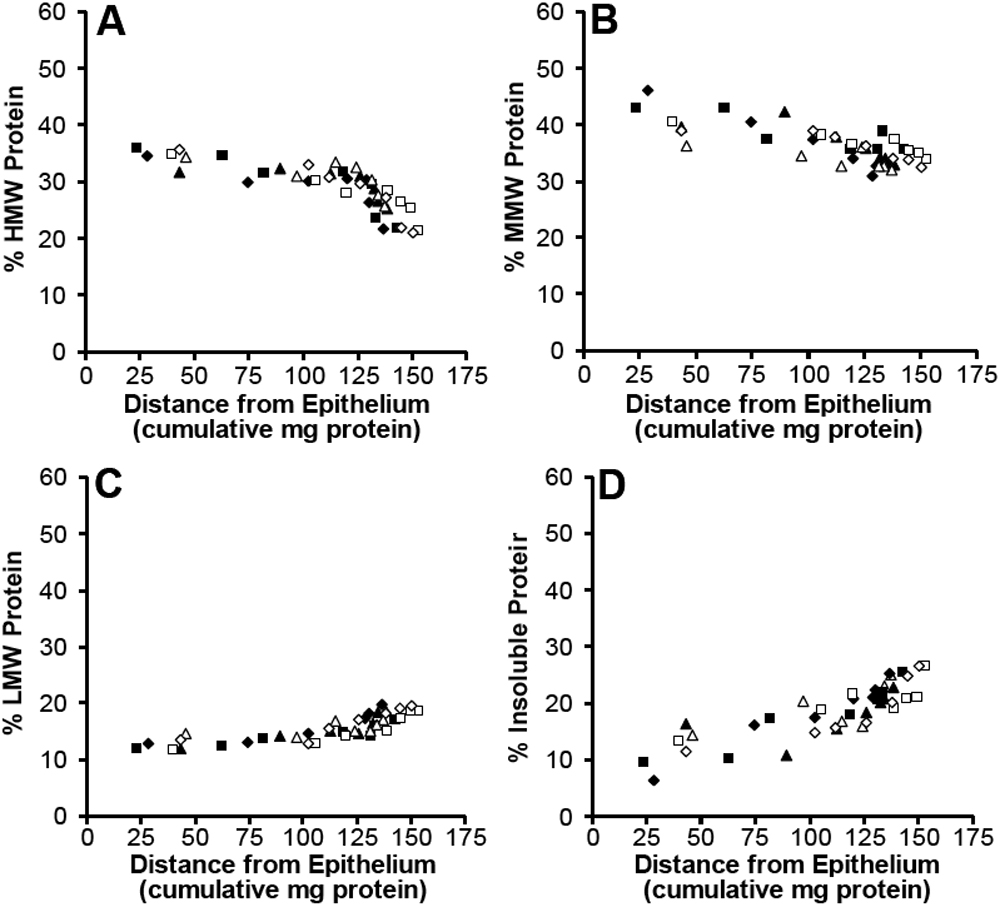
Figure 2. Protein distribution patterns in
6 representative porcine lenses. The proportions of HMW protein (A);
MMW proteins (B); LMW proteins (C) and insoluble protein (D)
are plotted as a function of the cumulative amount of protein from the
lens periphery to centre. With progression towards the lens
center there is a decrease in the HMW and MMW proteins and a
concomitant increase in LMW and insoluble proteins.