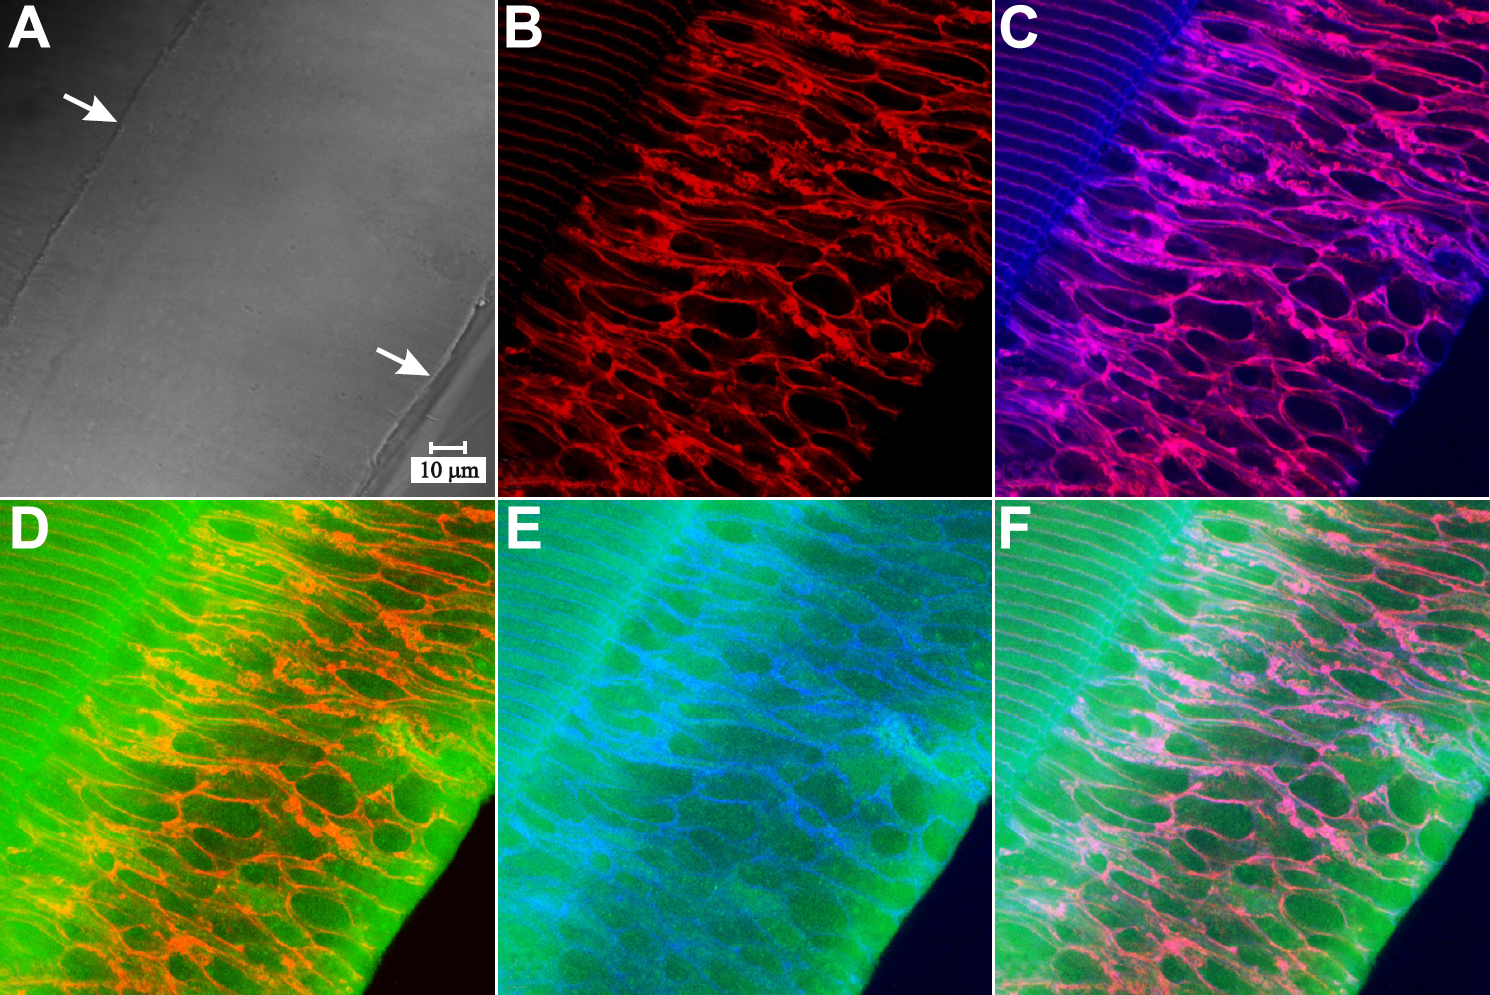
Figure 9. LSCM images of triple-labeling
for actin, pan-cadherin and myosin IIA in the peri-sutural region. A:
DIC image demonstrating the location of the beveled edge of the
Vibratome section; the lower right arrow indicates the edge of the
section and the upper left arrow indicates the extent of the bevel. B:
Actin immuno-fluorescence (red) delineates the fiber end profiles,
which are typically heterogeneous in size and shape in this region. C:
Merged actin and pan-cadherin (blue) fluorescence demonstrates nearly
complete colocalization in the BMC (purple). D: Merged actin
and myosin IIA fluorescence (green) shows the diffuse distribution of
myosin. The areas where these components are colocalized appear orange,
indicating that actin predominates at the BMC periphery. E:
Merged myosin IIA and pan-cadherin shows a comparable pattern to that
in D, i.e. although both proteins are colocalized at the
borders of profiles, the deep turquoise color indicates that
pan-cadherin fluorescence is more pronounced. F: Merged actin,
pan-cadherin, and myosin IIA fluorescence demonstrates the expected
distribution. The colocaliztion of all three components appears white
to pink. A through F show the same field of view and
are at identical magnification.