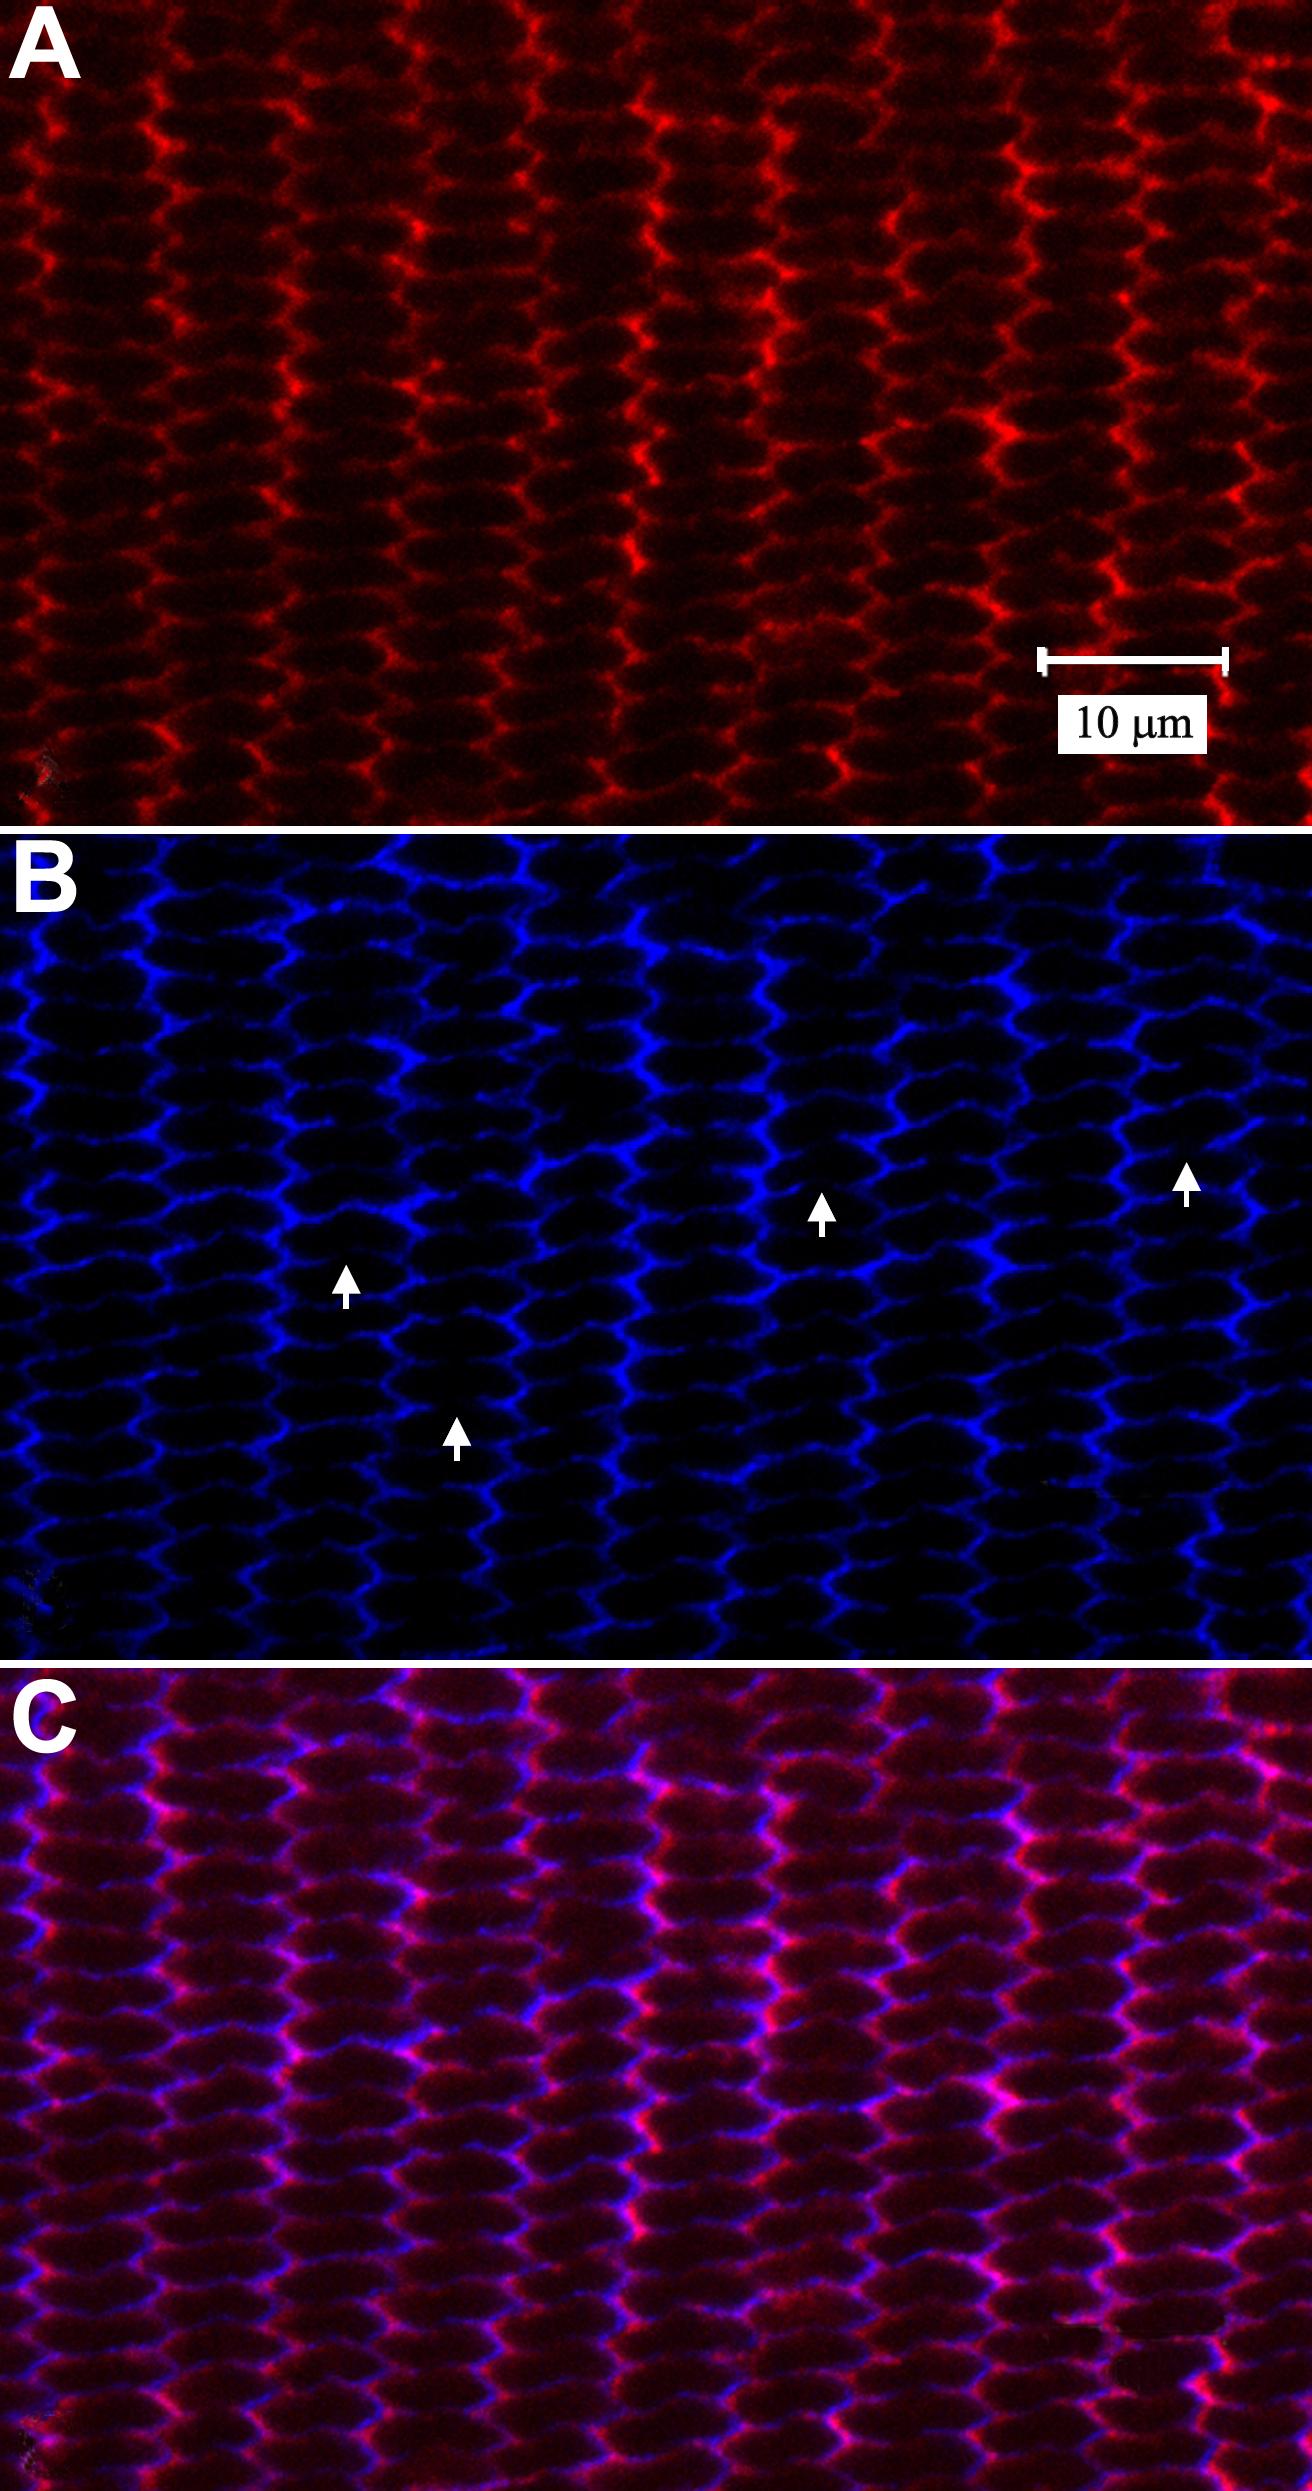
Figure 8. LSCM visualization of
double-labeling for actin and pan-cadherin in the equatorial segments
of elongating fibers. A: Flattened hexagonal fiber
cross-sections showed actin (red) concentrated along the short faces
with faint label along broad faces. B: Cadherin (blue) was more
prominent along the short sides of fiber profiles whereas the broad
sides demonstrated reduced and often discontinuous labeling (arrows). C:
As expected, merged actin and cadherin fluorescence (purple) displayed
a high degree of colocalization. Fibers shown are between 95 and 115
cells deep to the equatorial capsule, corresponding to fiber ends in
the distal portion of the lateral-posterior region of fiber end
migration. A through C are at the same magnification.