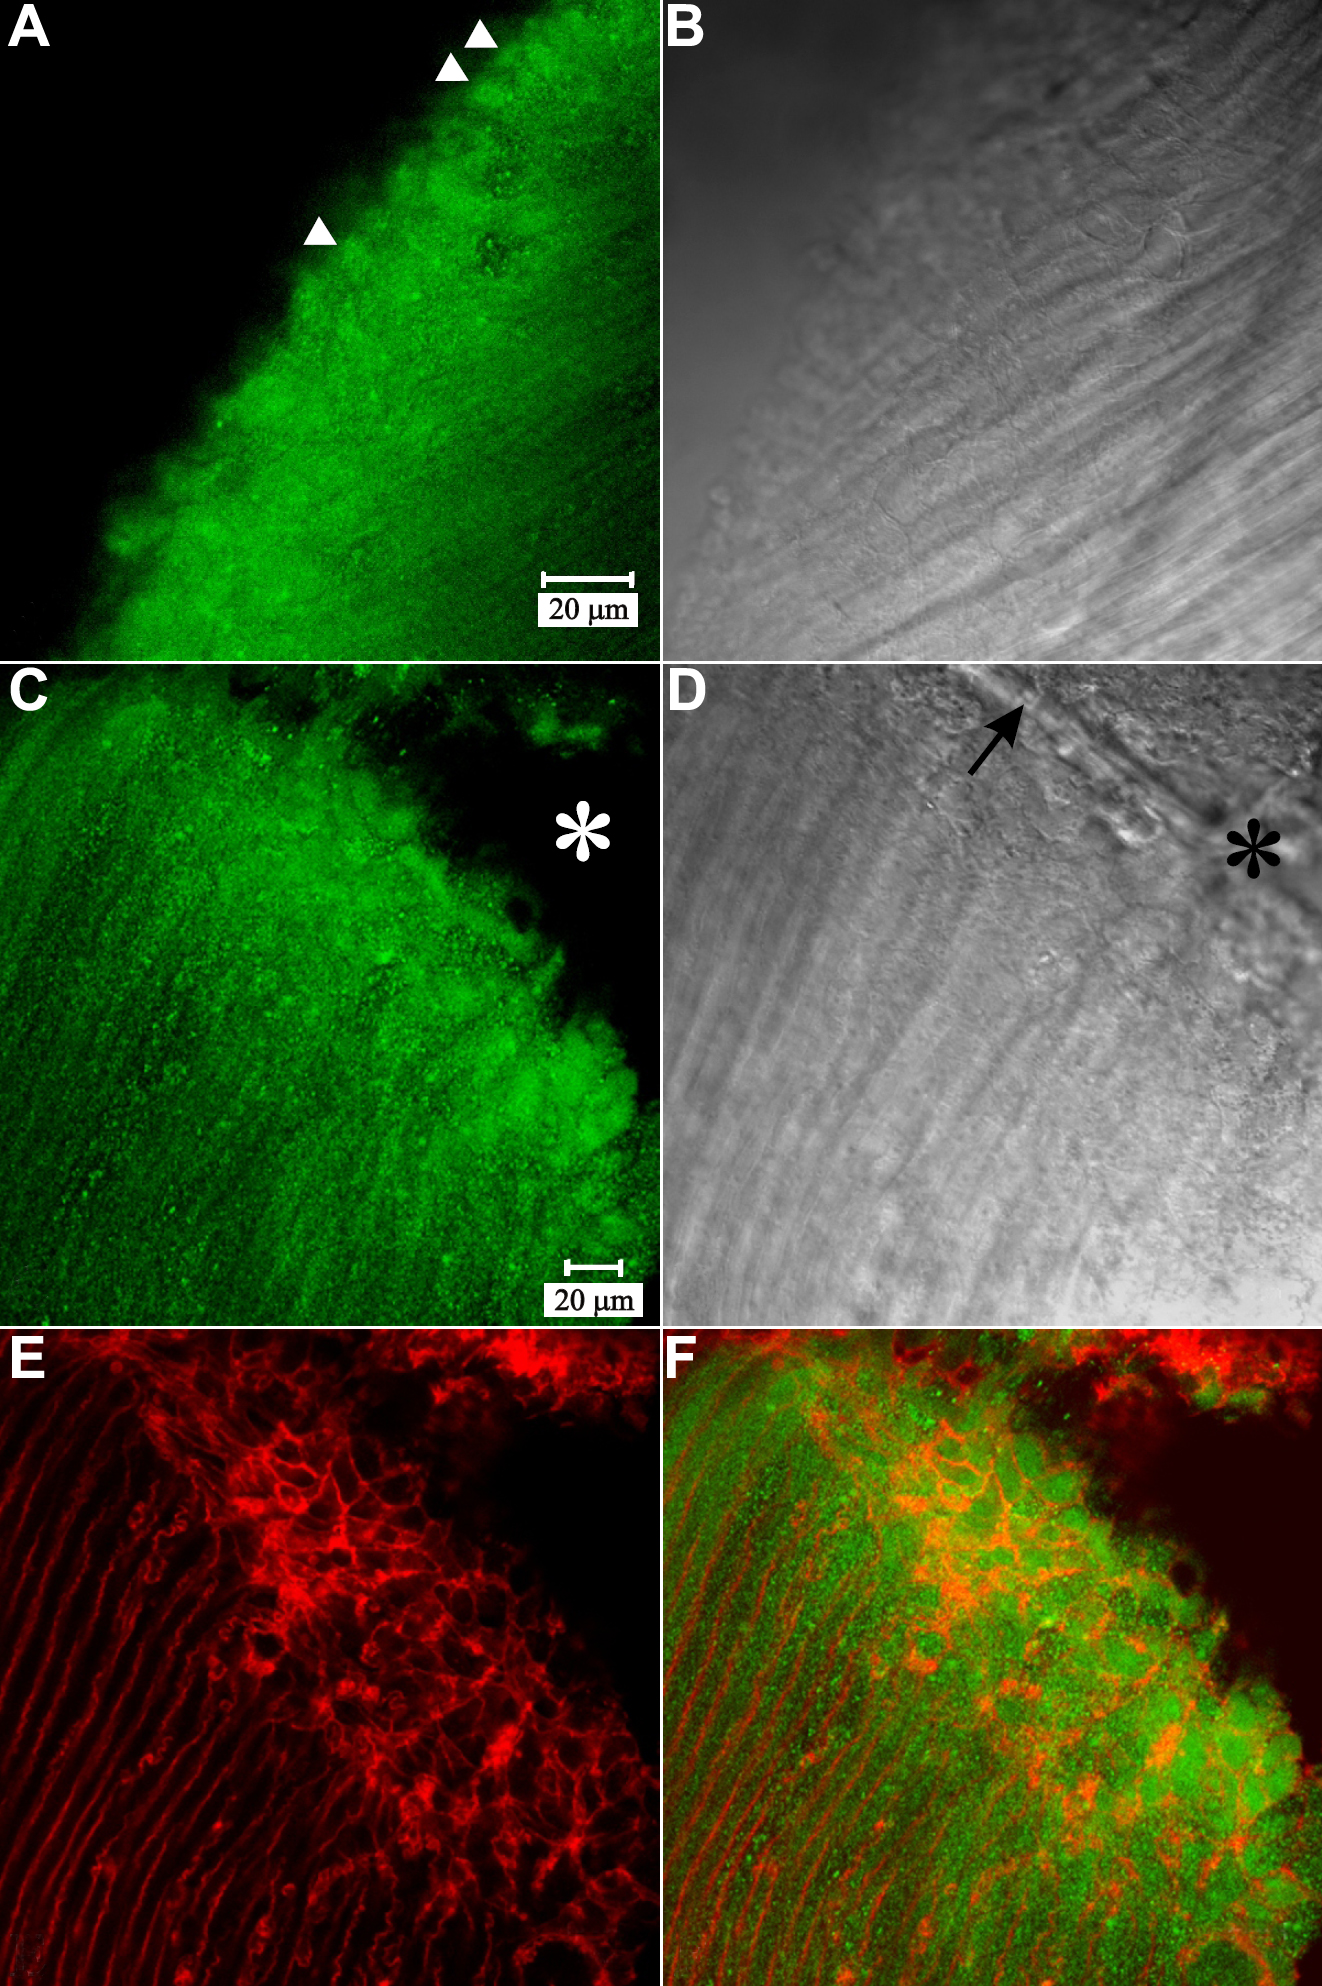
Figure 5. LSCM micrographs of myosin IIA
and actin immuno-fluorescence at posterior fiber ends. A-B:
Paired fluorescent (A) and DIC (B) images of myosin IIA
labeling in the peri-sutural region. Myosin was localized as a diffuse
plaque in the BMC (arrowheads) and was also present filling the
cytoplasm of posterior fiber segments. A and B are at
identical magnification. C-F: The same field of view
showing myosin IIA fluorescence (C), the DIC image (D),
actin fluorescence (E) and the merged myosin-actin fluorescence (F)
at a suture branch. Basal fiber ends at the suture (D, arrow),
were delineated by actin (E and F, red profiles) and
were filled with myosin (C and F, green plaques).
Asterisks (C and D) indicate an area devoid of both
labels, which was due to an artifactual break in the vibratome section.
C through F are at identical magnification. The data
revealed that myosin IIA distribution in the BMC was consistent in the
sutural, peri-sutural, and lateral-posterior regions of fiber end
migration.