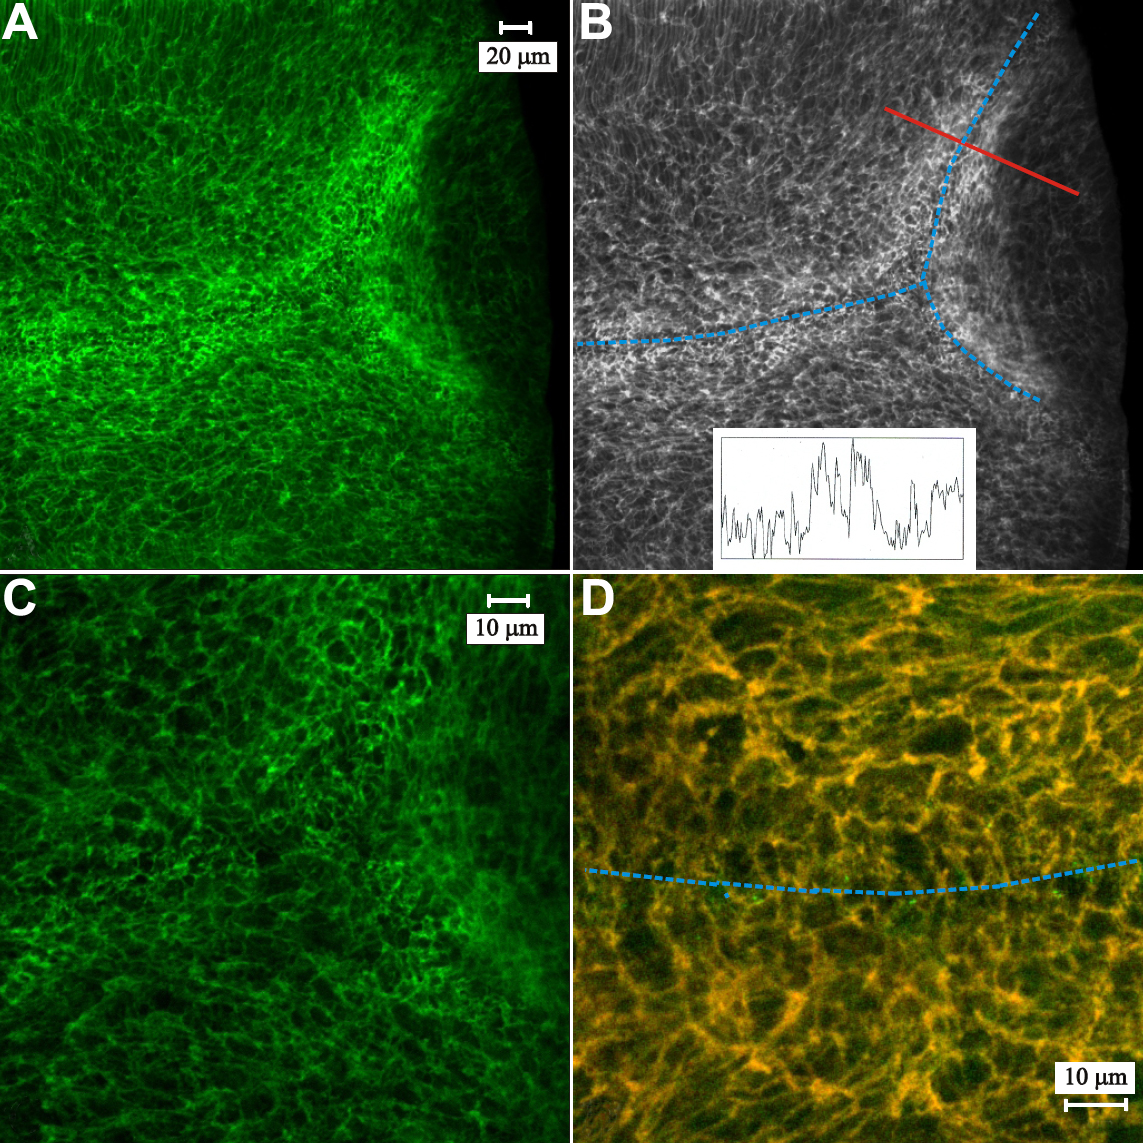
Figure 4. LSCM images of F-actin and
fodrin distribution at, and approaching the posterior sutures. A:
Low magnification overview of the peri-sutural and sutural regions of
fiber end migration. F-actin labeling in the BMC was enhanced as
migrating fiber ends approached a suture branch (left side) and forming
sub-branches (right side). B: A greyscale version of the
micrograph in A (identical magnification) is overlain to show
the location of the posterior suture branches (blue dotted lines), the
location where an optical density line scan (red solid line) was made
and the resulting plot (inset). Higher labeling intensity was present
within the sutural domain as demonstrated by peaks in the line scan. C:
Higher magnification of the convergence of suture sub-branches shown in
A. All BMC profiles showed strong peripheral labeling with faint
fluorescence present within the brighter profiles. Fiber ends in
sutural regions were rearranged into numerous smaller profiles. D:
A merged image of double-labeling for F-actin (red) and fodrin (green)
at a suture branch (blue dotted line) illustrates the extensive
colocalization (yellow) of these two cytoskeletal components. The data
indicates that actin is probably anchored to the membrane skeleton in
the BMC at this location, which includes the sutural region and a
portion of the adjacent peri-sutural region of fiber end migration.