Figure 3 of Lu, Mol Vis 2008; 14:1187-1203.


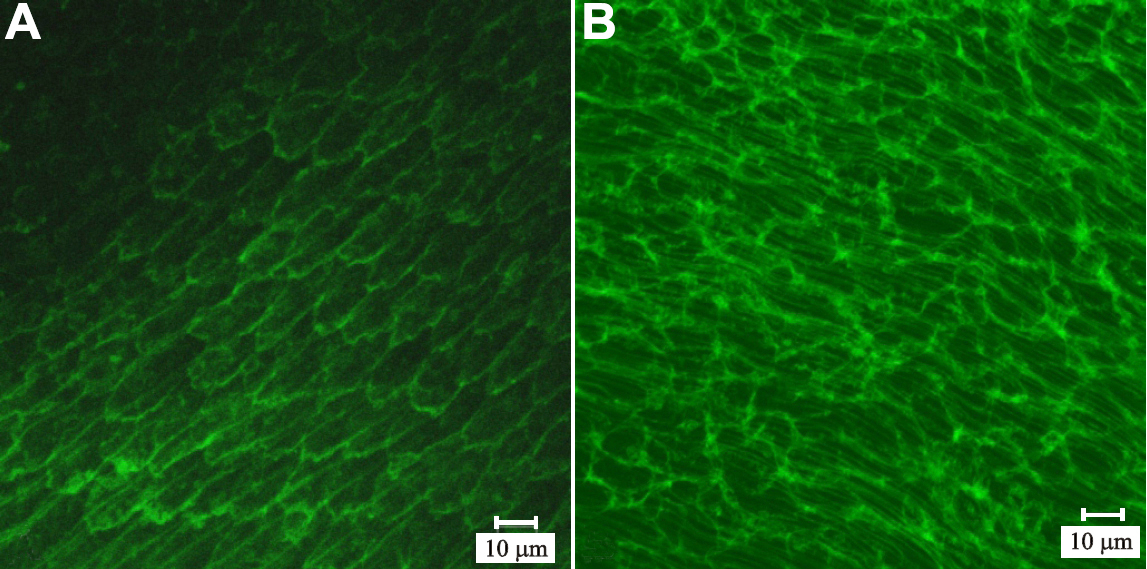
Figure 3. Animations of LSCM z-series from phalloidin-labeled basal fiber ends in the lateral-posterior region of fiber end migration. Animation 1 (left): Sheared-off fiber ends adhered to the lens capsule after prefixation and decapsulation were imaged from the capsule (z=0 µm), through the CFI (z≈1 µm) and to a depth of z=5 µm. Faint F-actin fluorescence was visible at the CFI, which was gradually visualized as distinct profiles with diffuse staining in the rest of the BMC (z=2 µm through z=4 µm). By z=5 µm, lateral membrane staining of fibers was noted, indicating that in some areas, portions of elongating fibers were stripped away from the lens during decapsulation. Z-distance between frames is equal to 1 µm. Animation 2 (right): Intact fiber ends in thick (100 µm) vibratome sections taken from the posterior lens surface. In sections taken beginning at the posterior pole, faint, scattered actin fluorescence was detected at the CFI, consistent with the presence of filopodia at this interface. Fiber end profiles were discernable by z=1µm. Lateral borders of fibers deep to the ends were detected by z=4 µm and were distinct by z=5 µm. Z-distance between frames is equal to 1.0 µm. A and B A and B show z-projections of each animation.

Note that the slide bar at the bottom of the quicktime movie can be used to manually control the flow of the movie. If you are unable to view the movie, a representative frame for each movie is included below (A and B).

This animation requires Quicktime 6 or later.
Quicktime is available as a free download.