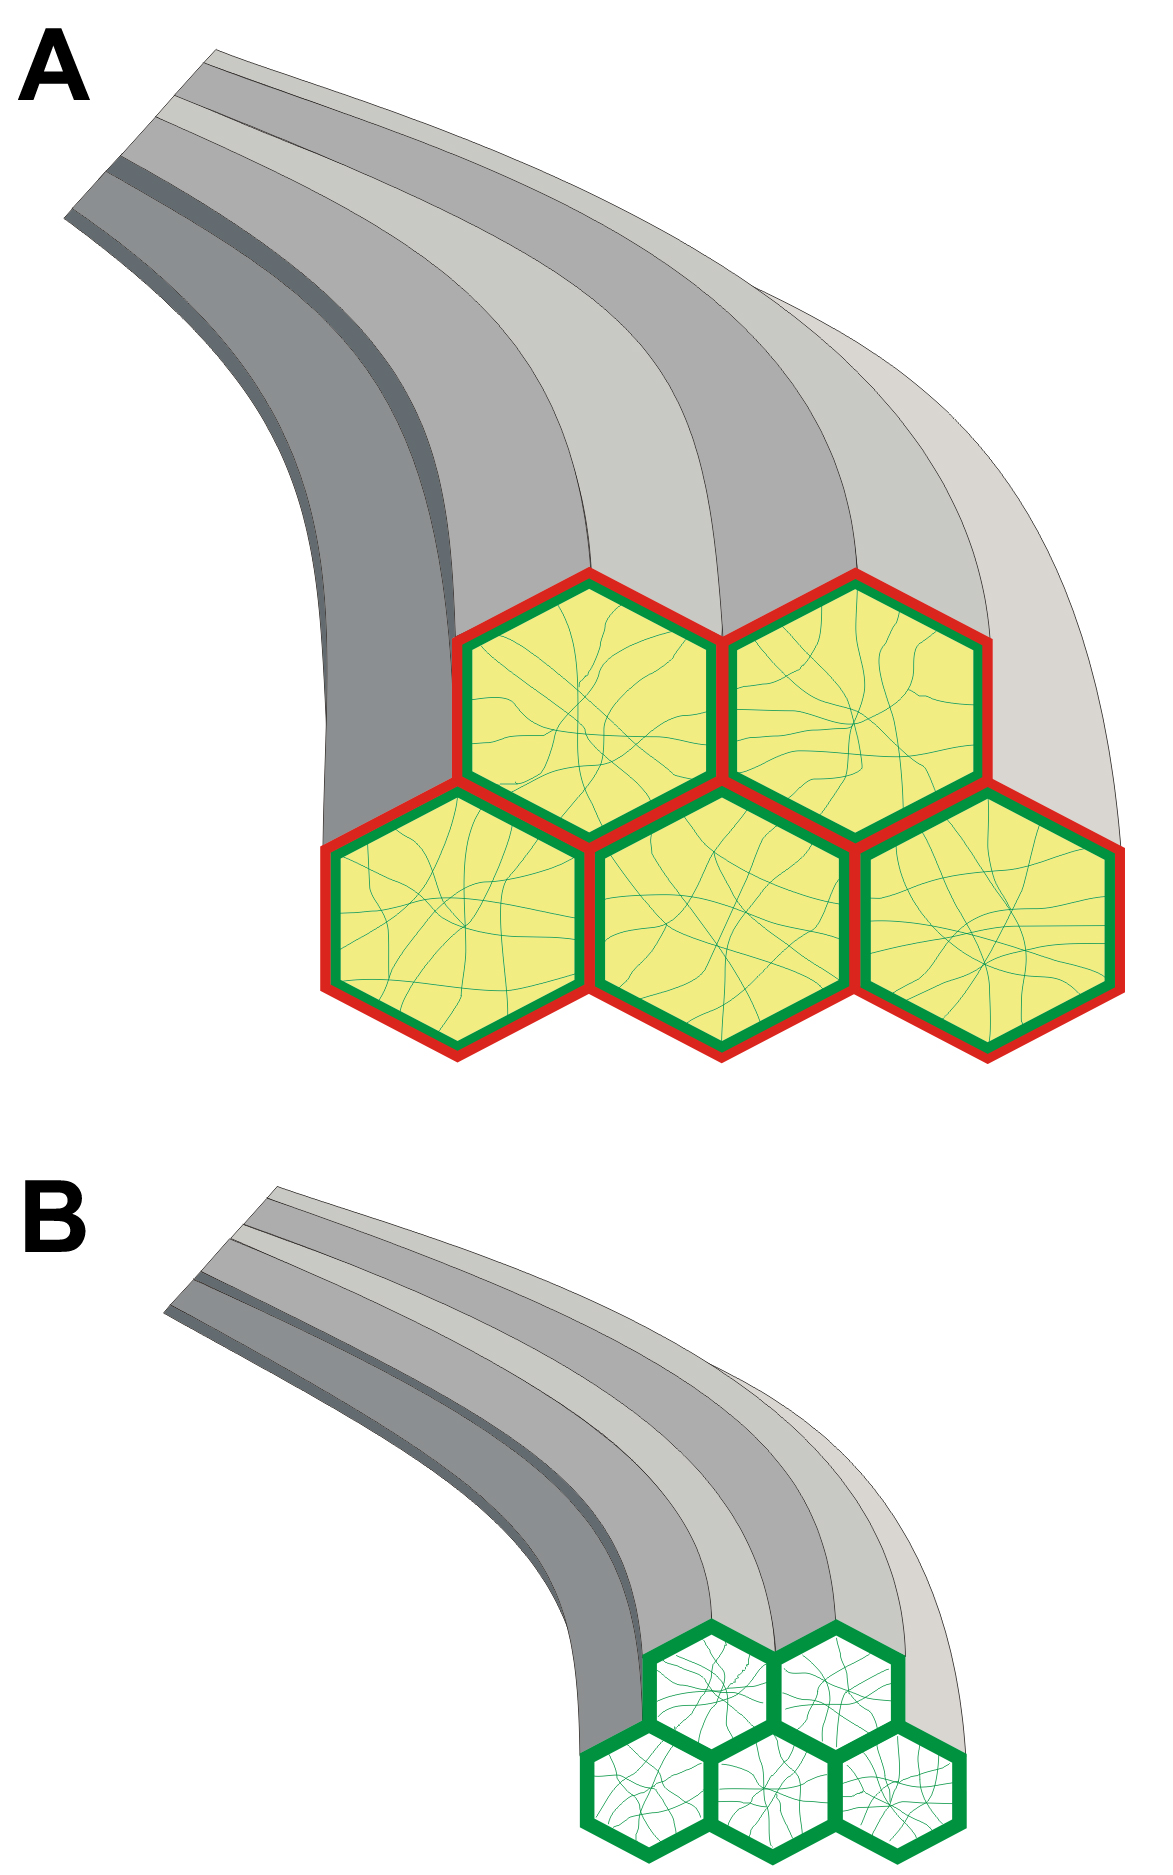
Figure 12. Diagram of the distribution of
BMC components. A: In the peri-sutural region, both cadherin
(red) and F-actin (green) were localized predominantly at the periphery
of BMC profiles (hexagons). Some F-actin was present within the
remainder of the BMC (green filaments) and β1 integrin (yellow) was
localized throughout the BMC. B: In the sutural region of fiber
end migration, peripheral staining for F-actin was somewhat enhanced,
whereas neither β1 integrin nor cadherin was apparent. Myosin is not
depicted because its distribution does not change as basal fiber ends
detach from the capsule and interface with opposing fiber ends at
posterior sutures.