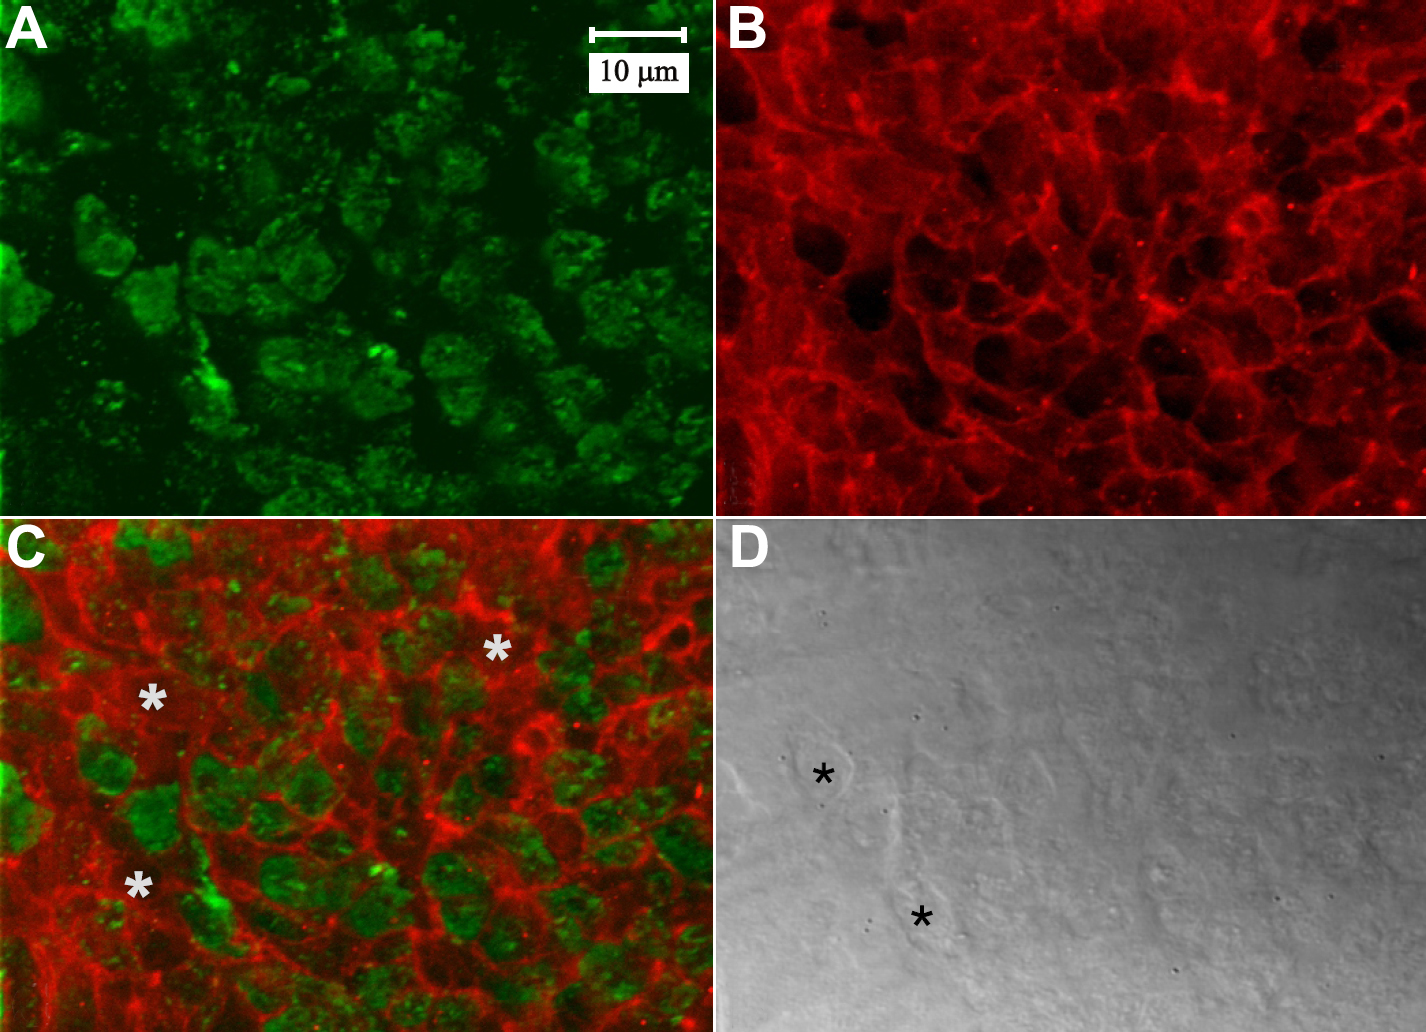
Figure 10. LSCM images of double-labeling
for β1 integrin and F-actin in the peri-sutural region. Whereas β1
integrin (A) was distributed throughout the BMC as a plaque,
F-actin (B) was most prominent at the margins of fiber ends. A
merged fluorescent image (C) of β1 integrin (green) and F-actin
(red) showed that they were not markedly co-localized. White asterisks
denote profiles without integrin label. D shows the paired DIC
image of the same field of view. Fiber ends are discernable (black
asterisks). A through D are at the same magnification.