Figure 1. Color image of c-erbB2 oncogene antisense probe in the atomic force microscopy. A: Distribution of c-erbB2 oncogene antisense probe under atomic force microscopy is shown. The red, green, and blue colors
in the image indicate probe density from the highest (red) to the lowest (blue). B: The structure for part of dextran and ASODN exhibited. The framed rectangle area in A shows part of the constitution of dextran and ASODN; the atom and basic groups were outline with white dots. The semicircle
on the left was an open loop of dextran, the straight line in the middle was a carbochain, which linked amino-group and six
carbon atoms of ASODN, and the three pent-loops on the right were deoxyribose loops at the end of ASODN. The total diameter
of the antisense probe was 25–40 nm, and the length of ASODN was 5 nm.
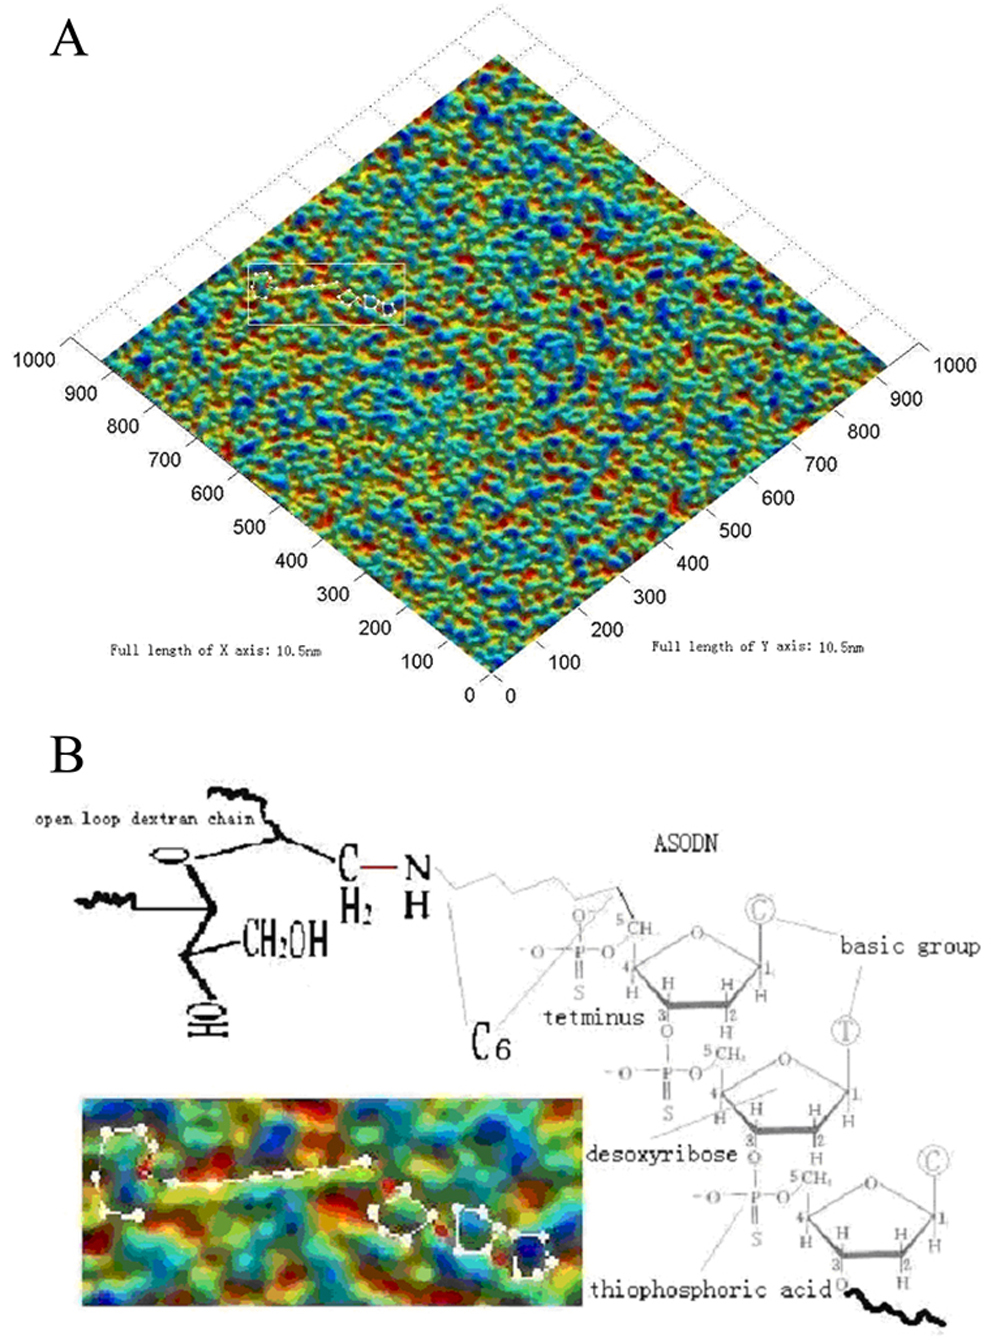
 Figure 1 of
Wen, Mol Vis 2008; 14:114-117.
Figure 1 of
Wen, Mol Vis 2008; 14:114-117.