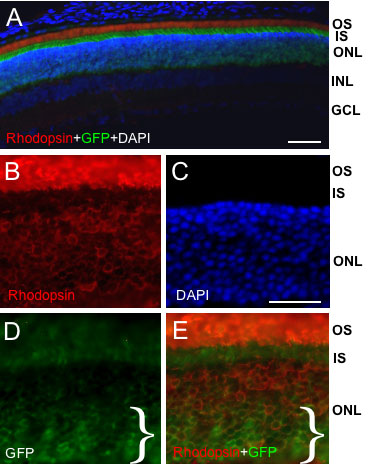
Figure 5. Distribution of rhodopsin
relative to egr-1-d2EGFP transgene expression. Representative
fluorescence microscopic images of transverse sections of adult rat
retina showing detection of total cells (DAPI staining), and
immunoreactivities for d2EGFP (green fluorescent protein, GFP) and
rhodopsin. Animals were killed at 24:00 h. A: Low magnification
image showing the massive abundance of rhodopsin protein in the outer
segment (OS) region that obscures visualization of (OS) GFP. Note that
exposure of the “red” fluorescence signal is minimized in this image
(relative to B and E) such that the much lower level of
rhodopsin fluorescence in the ONL is not detectable. Bar=50 μm. B-E.
Relative expression of rhodopsin and GFP across the ONL; note the
relative abundance of GFP in the inner zone of the ONL, which is
indicated by a bracket (}), whereas rhodopsin is expressed at similar
abundance across the extent of the ONL. Bar=20 μm. Abbreviations: OS,
photoreceptor outer segment; IS, photoreceptor inner segment; ONL,
outer nuclear layer; INL, inner nuclear layer; GCL, ganglion cell layer.