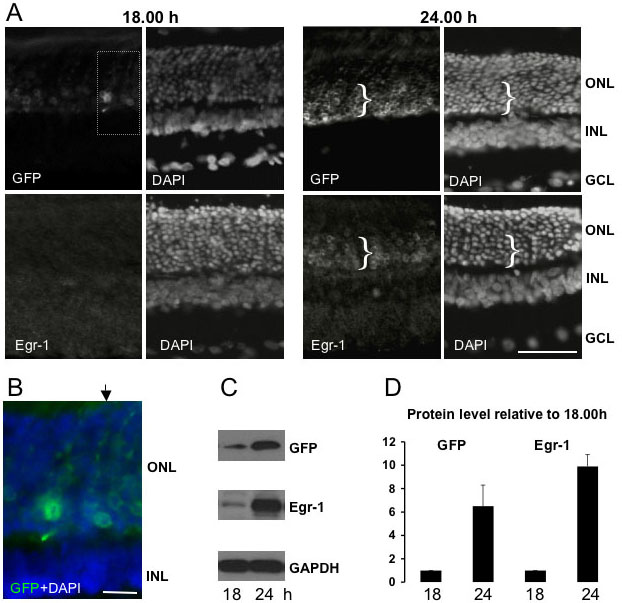
Figure 4. Nocturnal induction of the
egr-1-d2EGFP transgene. A: Representative fluorescence
microscopic images of transverse sections of adult rat retina showing
detection of total cells (DAPI staining), and immunoreactivities for
d2EGFP (green fluorescent protein, GFP) and Egr-1. Animals were killed
either before (18:00 h) or after (24:00 h) the onset of darkness. Note
the marked increase in ONL GFP and Egr-1 at 24:00 h and the relative
abundance of expressing cells within the inner zone of the ONL, which
is indicated by a bracket (}). Bar=50 μm. B: Detail from A
(boxed) showing how the minimal ONL expression of GFP at 18:00 h
permits detection of varicosities within ONL fibers (one example of a
track of varicosities indicated by arrow). Bar=10 μm. C:
Representative images of western blots of retinal protein extracts
showing an increase in levels of both GFP and Egr-1 at 24:00 h relative
to 18:00 h. D: Relative levels of GFP and Egr-1 proteins at
18:00 h and 24:00 h detected as in C. Values are provided as
mean±S.E.M. and are calculated as fold-change relative to the 18.00h
level following correction against GAPDH levels. At each time point 3
rats were sampled Abbreviations: ONL, outer nuclear layer; INL, inner
nuclear layer; GCL, ganglion cell layer.