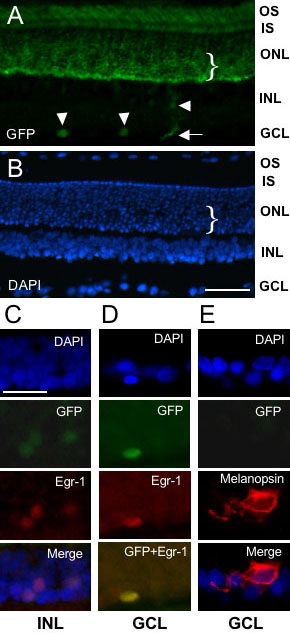
Figure 2. Relative abundance of transgene
expression across the retinal nuclear layers and co-localization with
Egr-1. Representative fluorescence microscopic images of transverse
sections of adult rat retina showing detection of total cells (DAPI
staining), and immunoreactivities for d2EGFP (green fluorescent
protein, GFP), Egr-1 and melanopsin. Animals were killed at 24:00 h. A,
B: Extensive view of transgenic rat retina illustrating the
abundant and uniform expression of GFP across the outer nuclear layer
(ONL), photoreceptor inner segment (IS), and photoreceptor outer
segment (OS) relative to the lower abundance and isolated cellular
expression within the inner nuclear layer (INL) and ganglion cell layer
(GCL). Vertical arrowheads indicate GFP-positive ganglion cells;
horizontal arrowhead denotes a GFP-positive INL cell; horizontal arrow
marks a GFP-positive process running up from the GCL. An inner zone of
the ONL is indicated by a bracket (}); note the relative abundance of
GFP within this inner ONL zone. C: Co-expression of GFP and
Egr-1 within three cells of the INL. Note that the low level of GFP is
not detectable in the merged image. D: Co-localization of GFP
and Egr-1 within a single cell of the GCL. E: Absence of GFP
within a giant melanopsin-positive cell of the GCL. The scale bar
represents 50 μm in A,B and 20 μm in C-E.