Figure 6 of
Devi, Mol Vis 2008; 14:1157-1170.
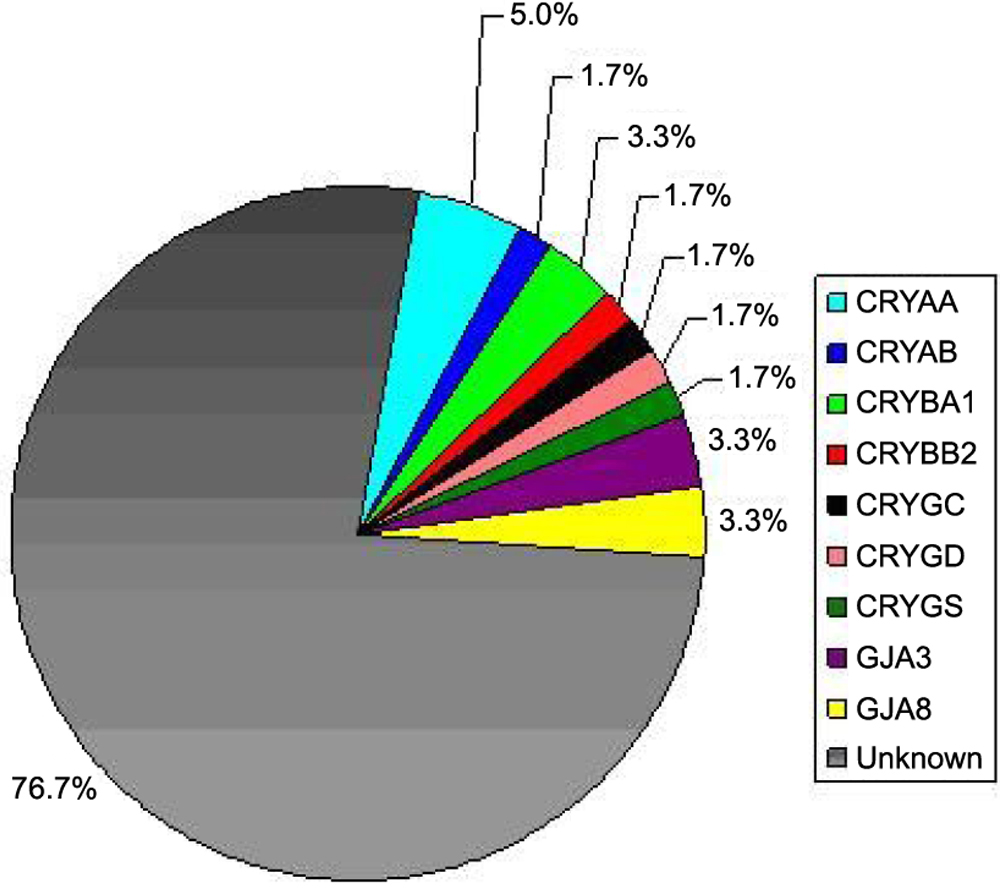
Figure 6.
Frequency of crystallin and connexin mutations in the south Indian population. Pie chart showing the frequencies of crystallin and connexin mutations in the south Indian popultaion as seen in this study and in references [
71
] and [
72
].