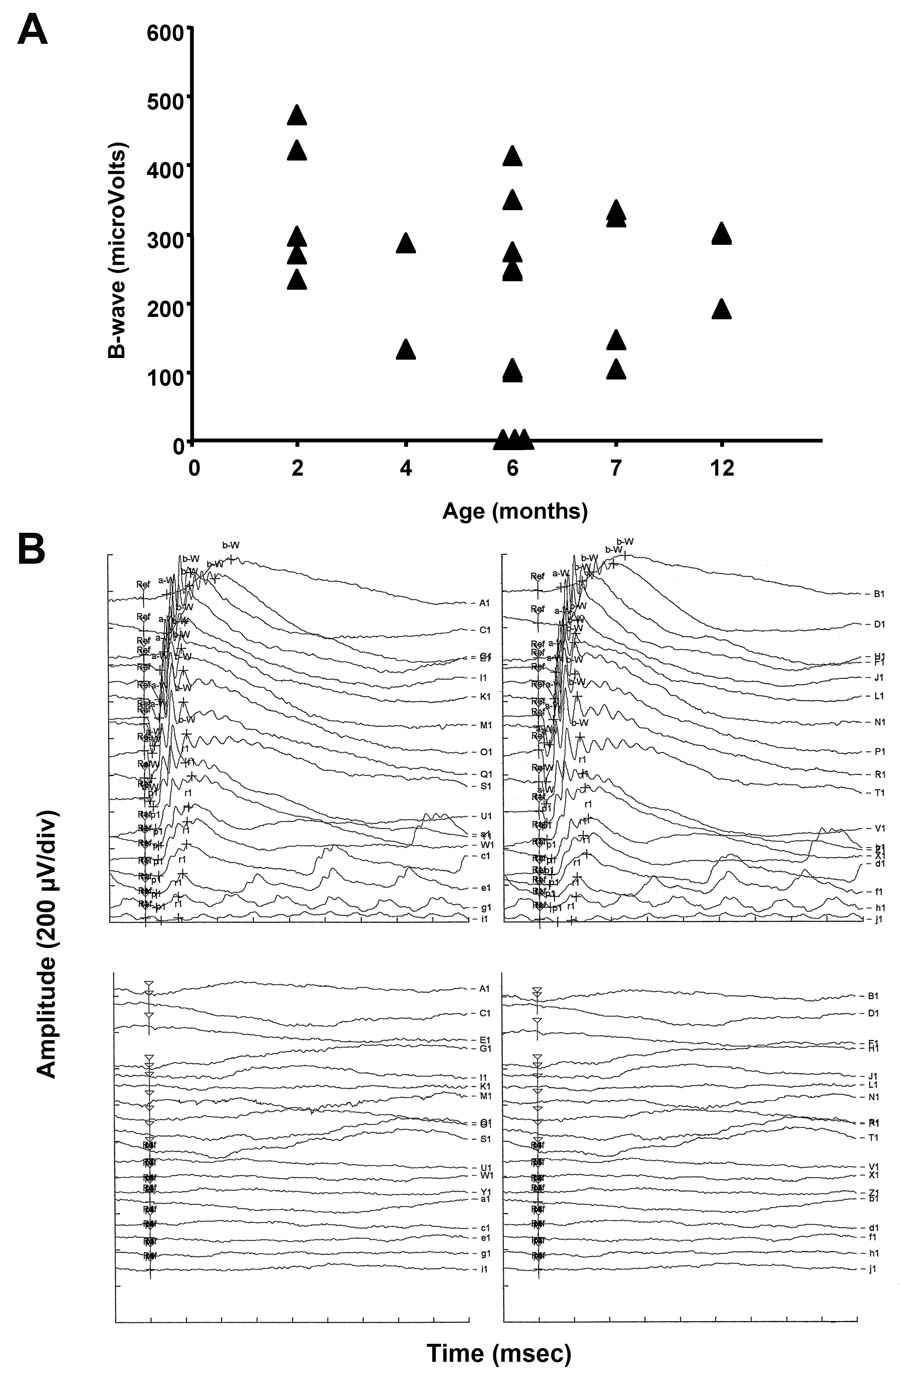
Figure 5. Electroretinogram analysis of
transgenic mice at various ages. A: Amplitudes of b-waves of
PGK-Groenouw transgenic mice’s electroretinogram (ERG) distributed in
function of their age. B: ERG recordings in response to single
flashes in scotopic conditions. Two different six-month-old PGK-BIG
Groenouw transgenic animals showed either a normal response (upper
panel) or a flat ERG (lower panel). Conditions: A1 to V1 shows records
with increasing intensities of light from 0.1 to 25000 mcds/m2
and each division of the time axis correspond to 40 ms. U1 to j1 shows
records with increasing frequencies of flashlight from 0.5 to 30 Hz and
each division of the time axis correspond to 50 ms.