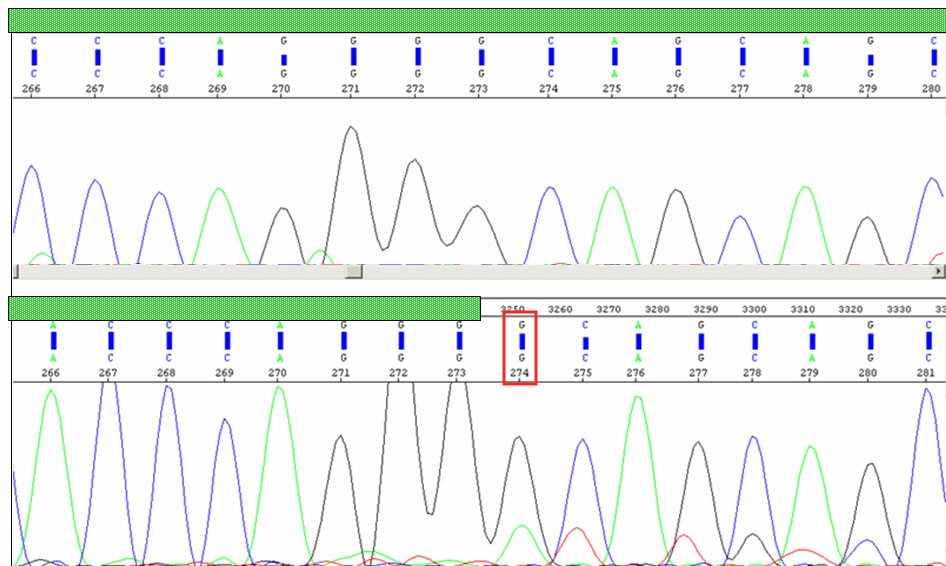
Figure 4. Electropherograms displaying
intron 6 retention. A comparison of a portion of PRPF31 cDNA
sequences between the unaffected (top: I-2) and the affected (bottom:
II- 1) revealed intron 6 retention in all affected and asymptomatic
individuals of family A. The green hatched box represents exonic
region, and the red rectangular box indicates the start position of
intron 6 retention (non-hatched) in the proband.