Figure 3. Changes in gene expression of c-jun, c-fos, c-myc, caspase 3, and p53 after triamcinolone acetonide treatment. A: For 1 mg/ml TA, the change of c-jun expression peaked at 20 min and the change kept a significant increase between 10 min
and 30 min. For 0.1 mg/ml TA, c-jun expression peaked at 50 min and kept significantly increasing between 10 min and 12 h.
The changes in gene expression were concentration dependent between the 10 min-12 h interval. Between 10 and 20 min, the c-jun
expression change was higher for 1 mg/ml TA treatment. However, the c-jun expression change was higher for 0.1 mg/ml TA treatment
between 30 min and 12 h. B: For 1 mg/ml TA, the change of c-fos expression peaked at 10 min and the change kept significant elevation between 10 min
and 80 min. For 0.1 mg/ml TA, there was no significant change in gene expression across various time points (p>0.05). Compared
to 1 mg/ml TA, the changes in gene expression were higher for 0.1 mg/ml TA treatment between 20 min to 30 min. C: The change of c-myc expression peaked at 30 min and 50 min for 0.1 mg/ml TA and 1 mg/ml TA treatment, respectively. The
gene expression change kept a significant increase between 10 min and 2 h for both TA concentrations. Compared to 1 mg/ml
TA, the change in gene expression was higher for 0.1 mg/ml TA treatment at 10 min, 30 min, 80 min and 48 h. D: The change of caspase 3 expression for both concentrations of TA maintained a significant increase between 50 min and 48
h. Compared to 0.1 mg/ml TA, the change was higher for 1 mg/ml TA treatment only at 50 min. E: The change of p53 expression for both concentrations of TA increased significantly from 50 min to 48 h. The change in gene
expression was concentration dependent between 2 h and 48 h. The expression change was greater for 1 mg/ml TA between 2 h
and 12 h while the change was greater for 0.1 mg/ml between 24 h and 48 h. Dotted lines represent initial gene expression
levels before eliminating benzyle alcohol (BA) effect from TA. Solid lines represent subtracted gene expression levels after
eliminating BA effect from TA.
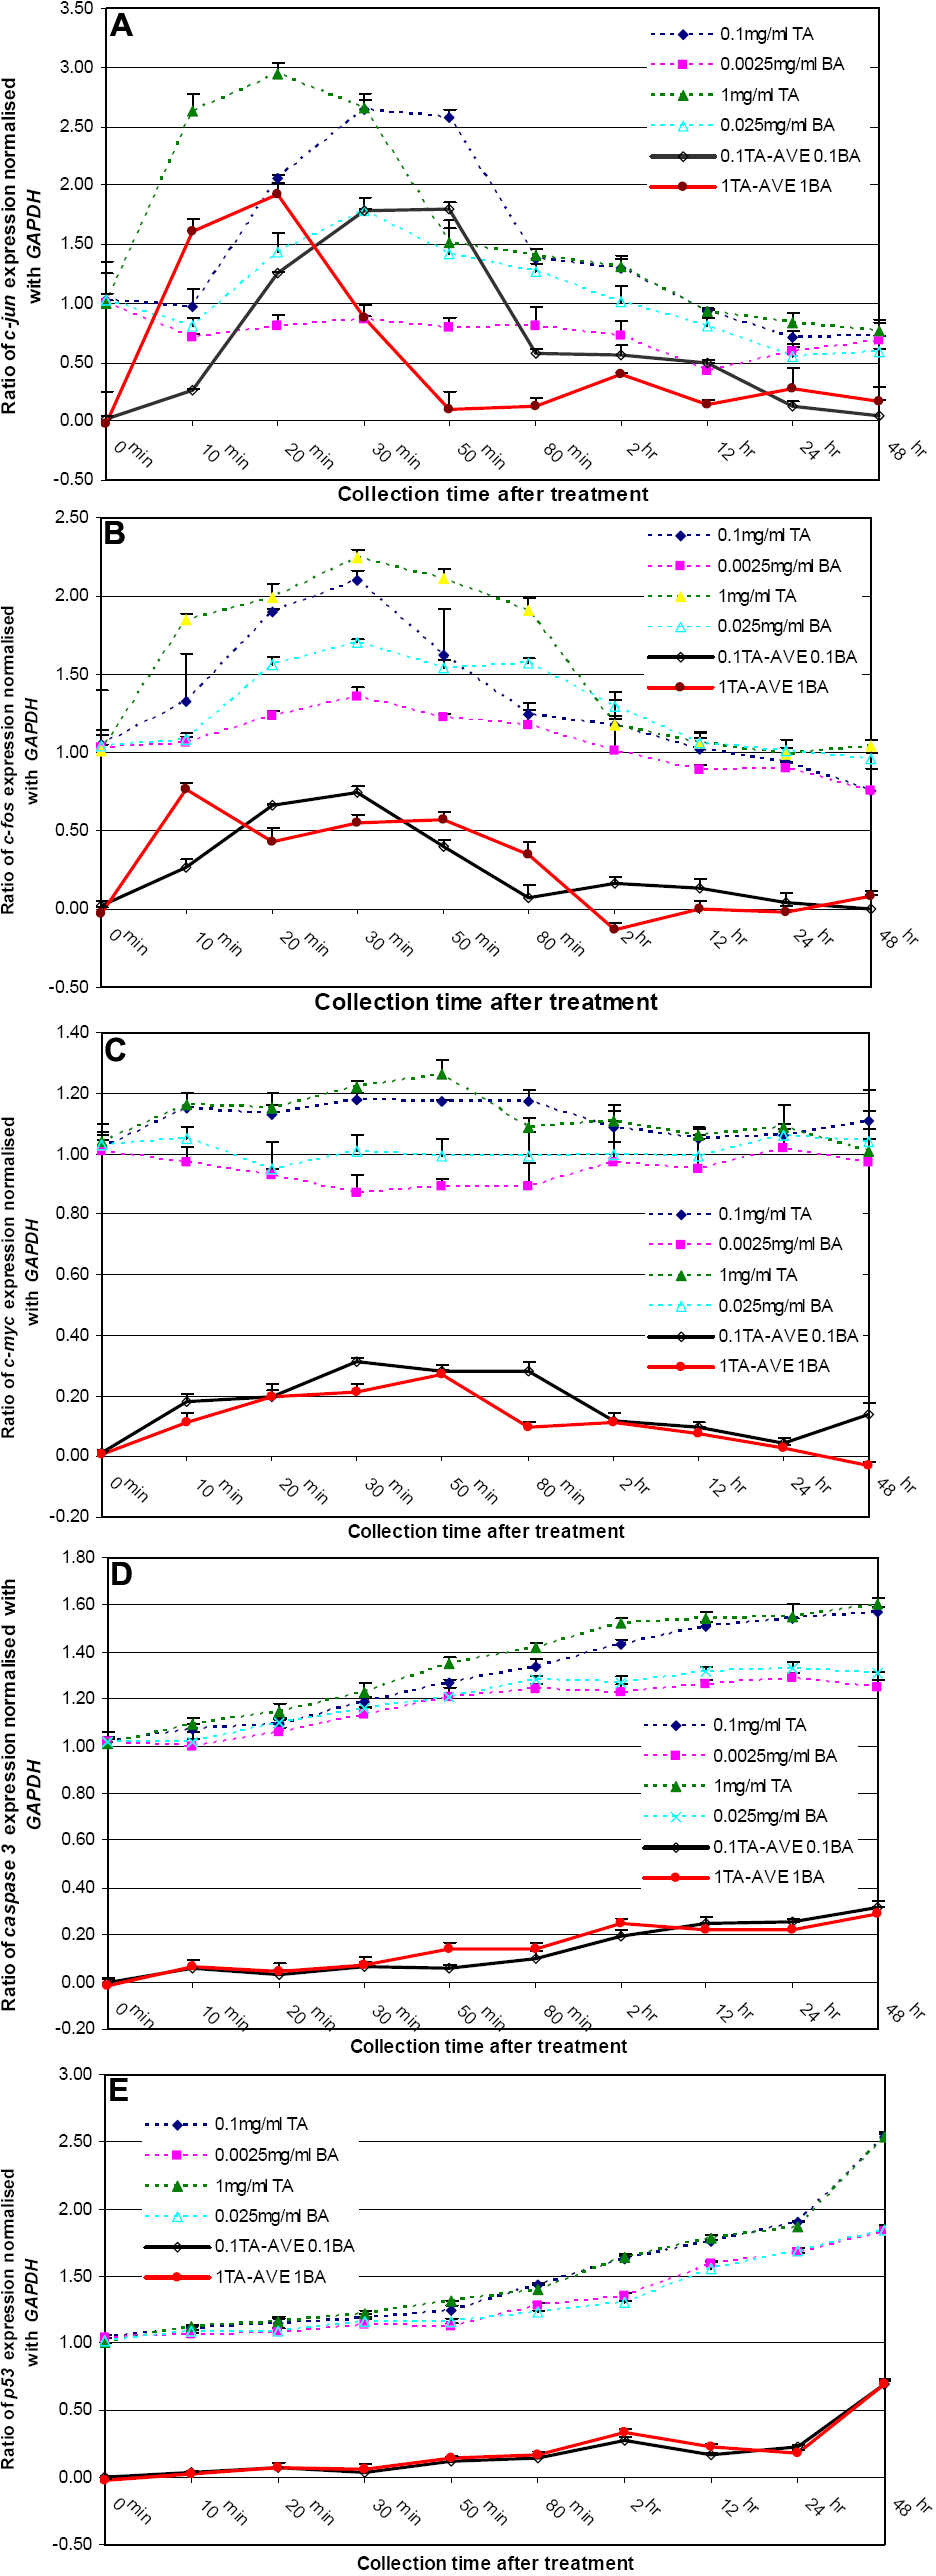
 Figure 3 of
Wang, Mol Vis 2008; 14:105-113.
Figure 3 of
Wang, Mol Vis 2008; 14:105-113.