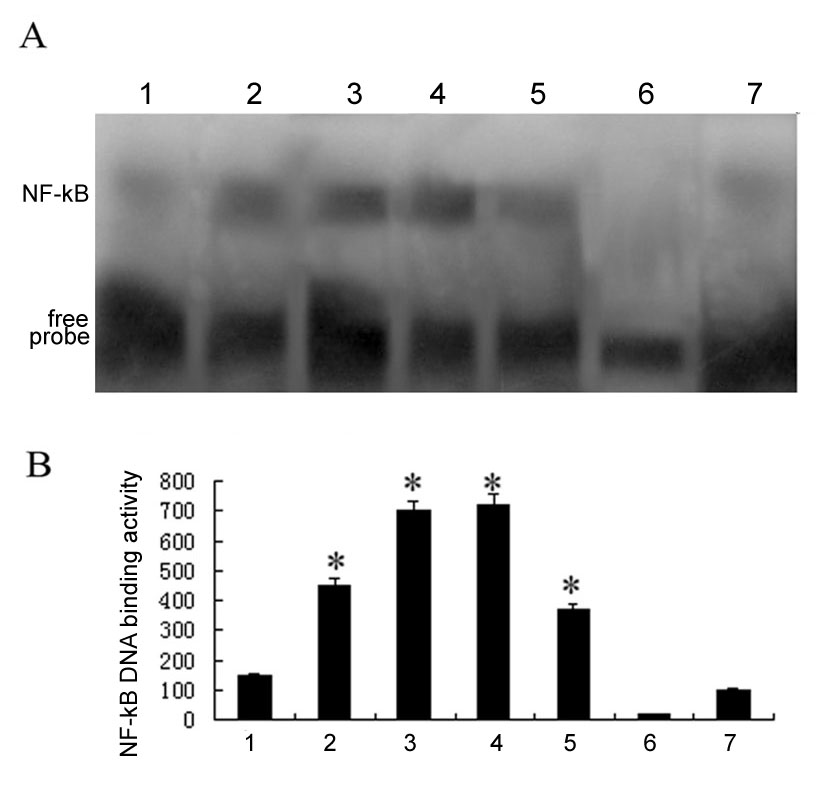
Figure 3. Electrophoretic mobility shift
assay showing increased NF-κB DNA–binding activity in developing rd
retinas. A: Representative gel shift analysis of NF-κB DNA and
nuclear protein combination in control and rd retinas. Lane 1:
NF-κB was constitutively active in control retinas. Lanes 2–5: NF-κB
DNA–binding activity in the nuclei of retinal cells in rd mice
at P10, P12, P14, and P16, respectively. Lanes 6 and 7: NF-κB
DNA–binding activity by competition electrophoretic mobility shift
assay (EMSA), with mutant and a hundredfold M excess of cold NF-κB
oligonucleotides, respectively. B: Quantification of NF-κB
DNA–binding activity in control and rd retinas shown in (A).
Note NF-κB DNA-binding activity in rd retinas were
significantly increased at P10, reached a peak at P12, and decreased at
P16 (*p<0.05, compared with the control retina, n=6).