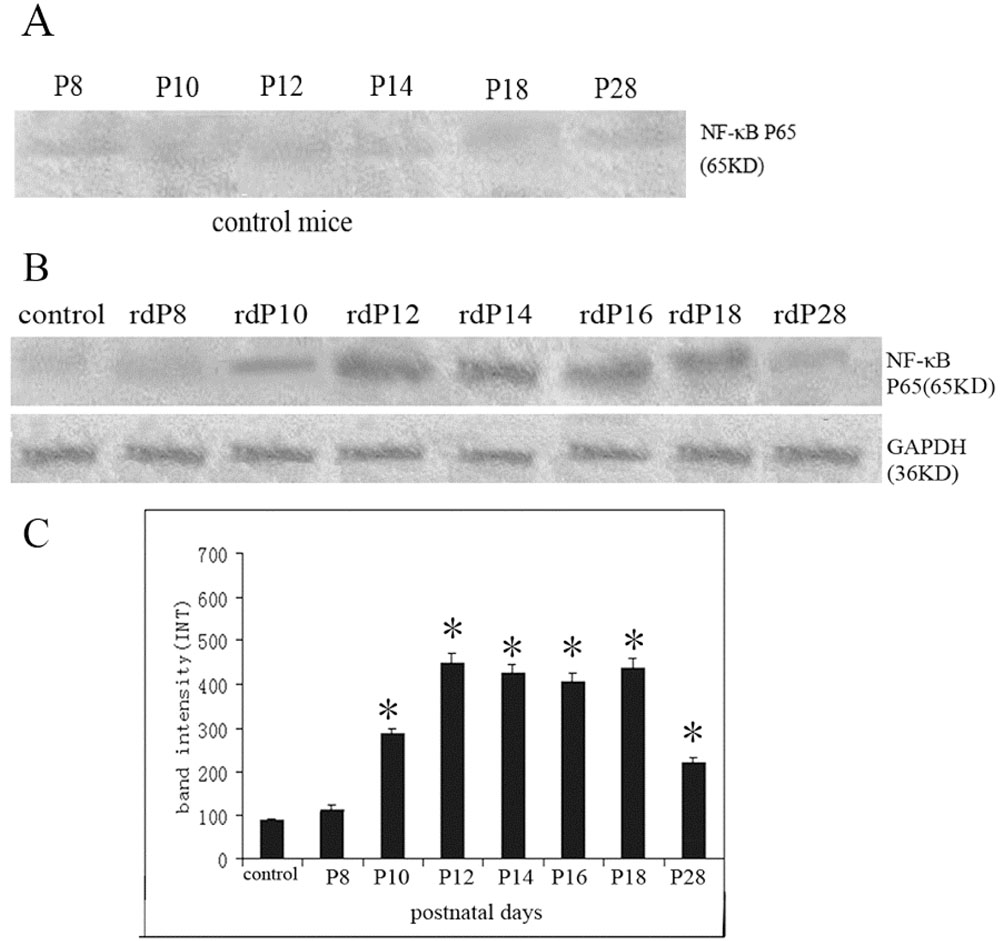
Figure 2. Western blot analysis of NF-κB
P65 protein levels in control and rd retinas for each age
group. A: Little expression of NF-κB P65 (bands at 65 kDa) was
found in the control retinas at different age groups. B: NF-κB
P65 protein was detected in the samples from rd retinas. GAPDH
(35 kDa) was used as a loading control. C: Intensitometry of
immunoreactive bands in rd retinas. Note the protein levels of
NF-κB P65 in rd retinas were significantly increased at P10 and
reached a peak at P12. It kept a high level up to P18 and was markedly
reduced by P28 (*p<0.05, compared with the control retina, n=6).