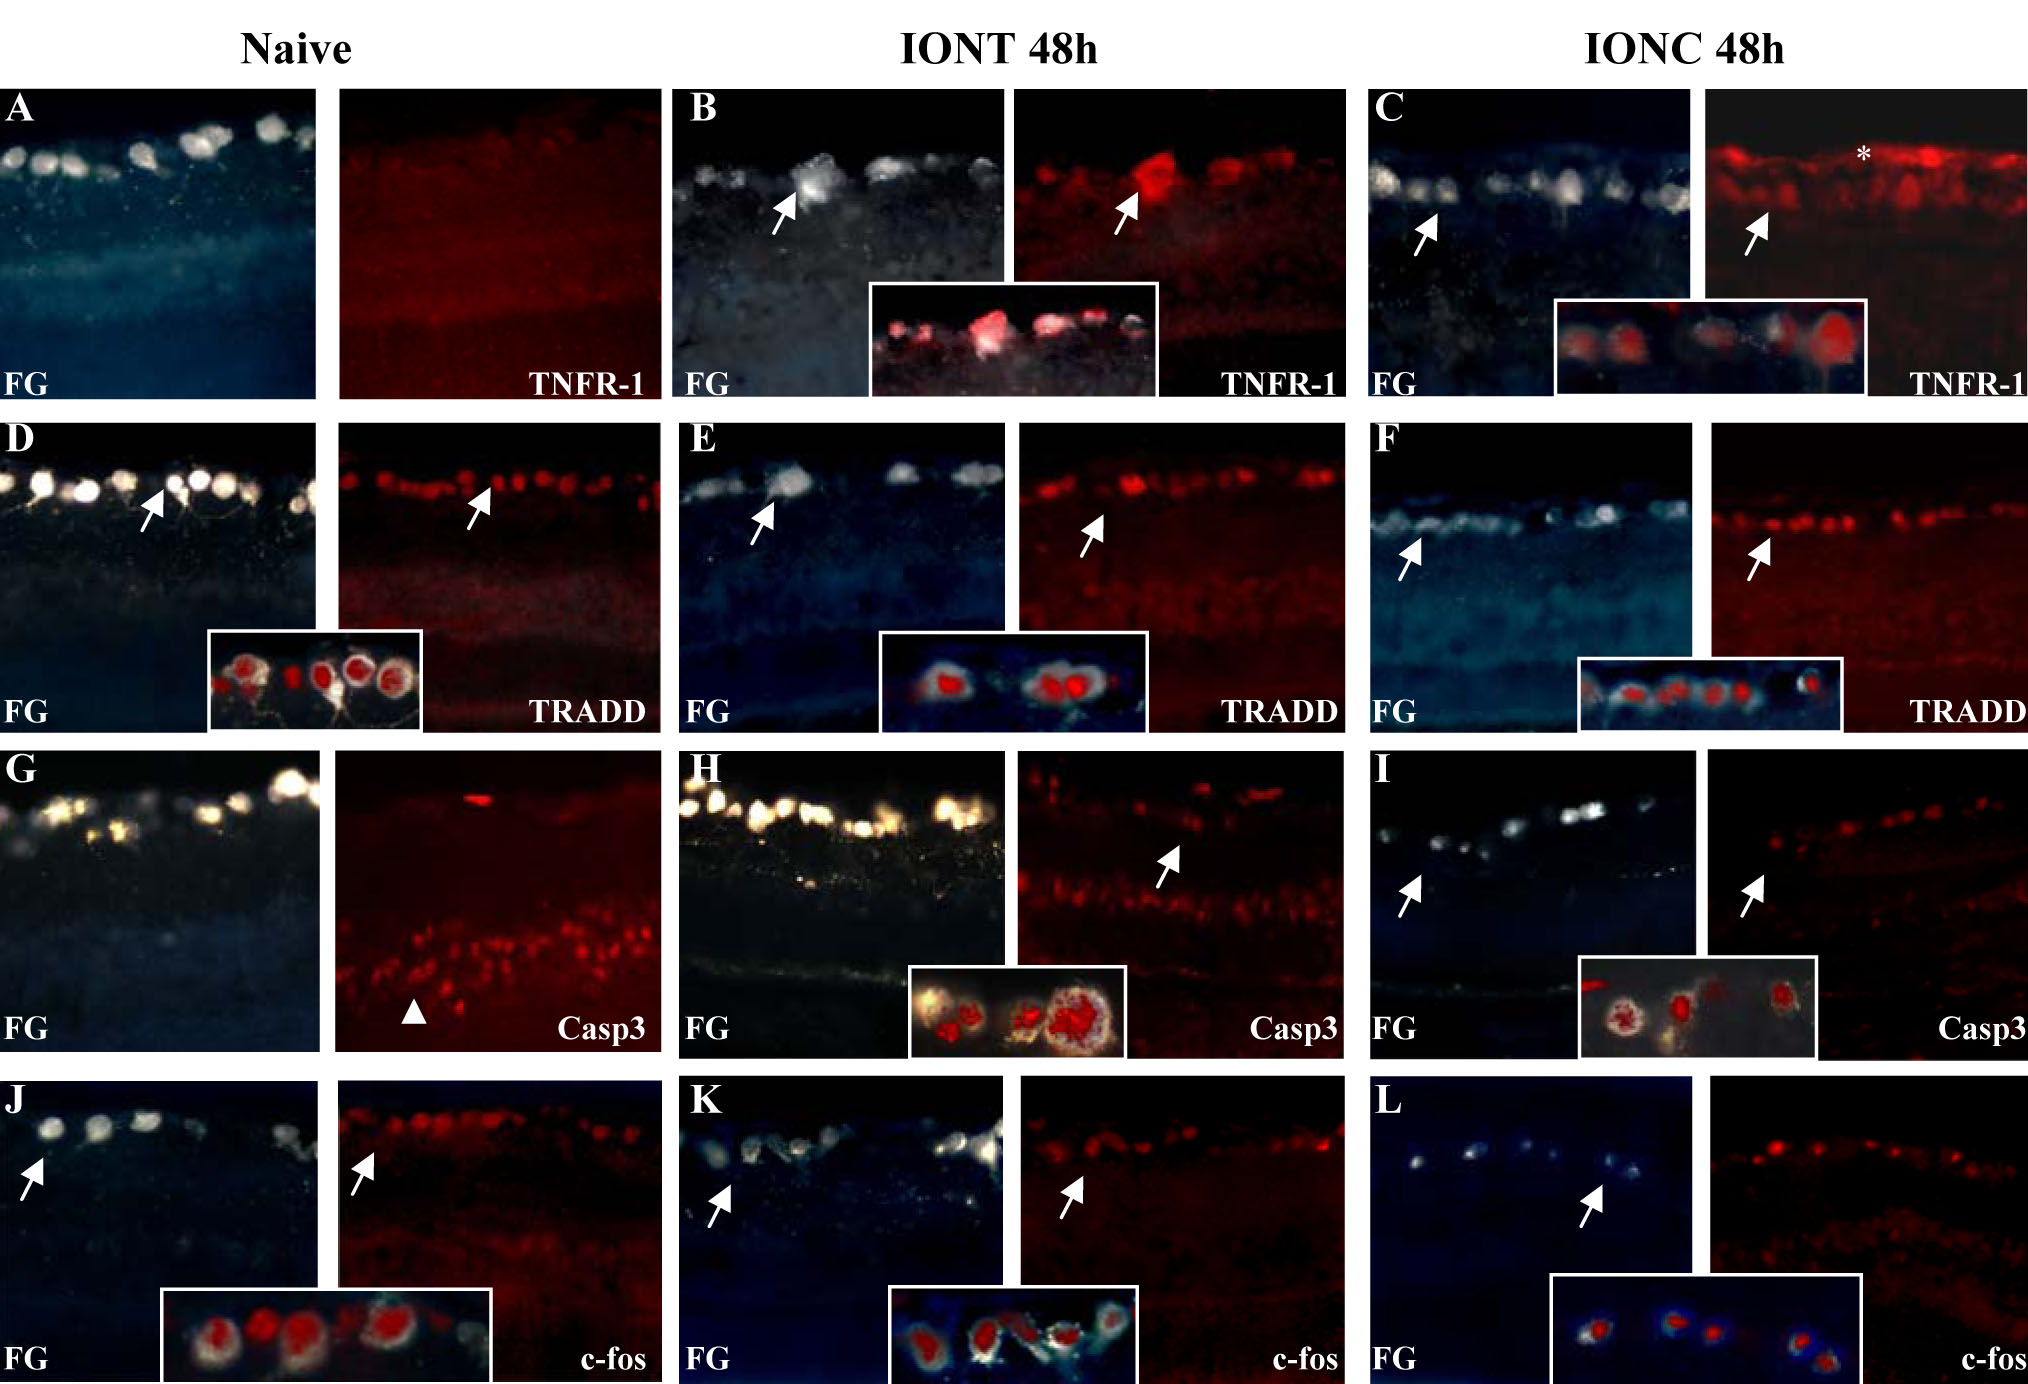
Figure 4. Expression pattern of cell
death–related proteins in naïve and optic nerve injured retinas.
Immunohistofluorescence analyses for tumor necrosis factor receptor
superfamily member 1a (TNFR1a), tumor necrosis factor receptor type 1,
associated death domain (TRADD), Caspase 3, and c-fos to
fluorogold-traced retinas in naïve, intraorbital nerve transection
(IONT) and intraorbital nerve crush (IONC) injured retinas. A-C:
Expression pattern of TNFR1a (red signal) in naïve retinas (A,
right), IONT-injured retinas (B, right) and IONC-injured retinas
(C, right). Left images are the corresponding fluorogold (FG)
images (blue signal). D-F: Expression pattern of TRADD (red
signal) in naïve retinas (D, right), IONT-injured retinas (E,
right) and IONC-injured retinas (F, right). Left images are the
corresponding fluorogold (FG) images (blue signal). G-I:
Expression pattern of Caspase 3 (red signal) in naïve retinas (G,
right), IONT-injured retinas (H, right) and IONC-injured retinas
(I, right). Left images are the corresponding fluorogold (FG)
images (blue signal). J-L: Expression pattern of c-fos (red
signal) in naïve retinas (J, right), IONT-injured retinas (K,
right) and IONC-injured retinas (L, right). Left images are the
corresponding fluorogold (FG) images (blue signal). Magnifications in
squares show the co-localization of a given protein with FG-labeled
retinal ganglion cells (RGCs). Arrows point to RGC, arrowheads indicate
the outer nuclear layer and asterisks mark the nerve layer.