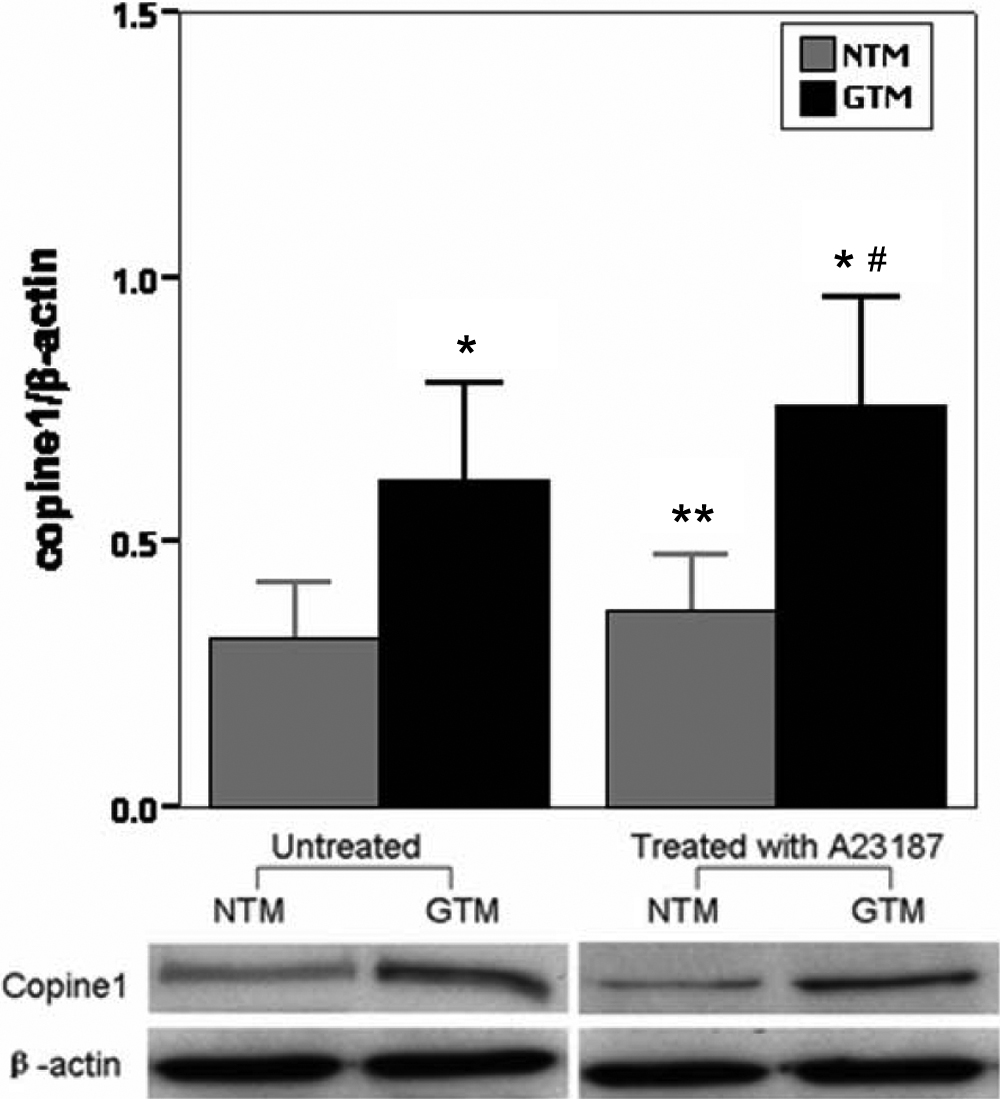
Figure 4. Western blot analysis using
monoclonal antibodies against copine1 and β-actin on the traditional
one-dimensional SDS–PAGE of trabecular meshwork cell total proteins.
Expressions of untreated and A23187-treated copine1 were analyzed using
the western blot method. The expression of β-actin was used as a
control. The expression levels were quantitated by measuring band
intensities and were expressed as fold induction of that in controls.
NTM: normal TM cells; GTM: glaucomatous TM cells. Data are means±SEM of
three independent experiments. The asterisk indicates a p<0.01
versus untreated NTM; the double asterisk indicates a p<0.01 versus
untreated GTM; and the sharp (hash mark) indicates a p<0.01 versus
NTM treated with A23187.