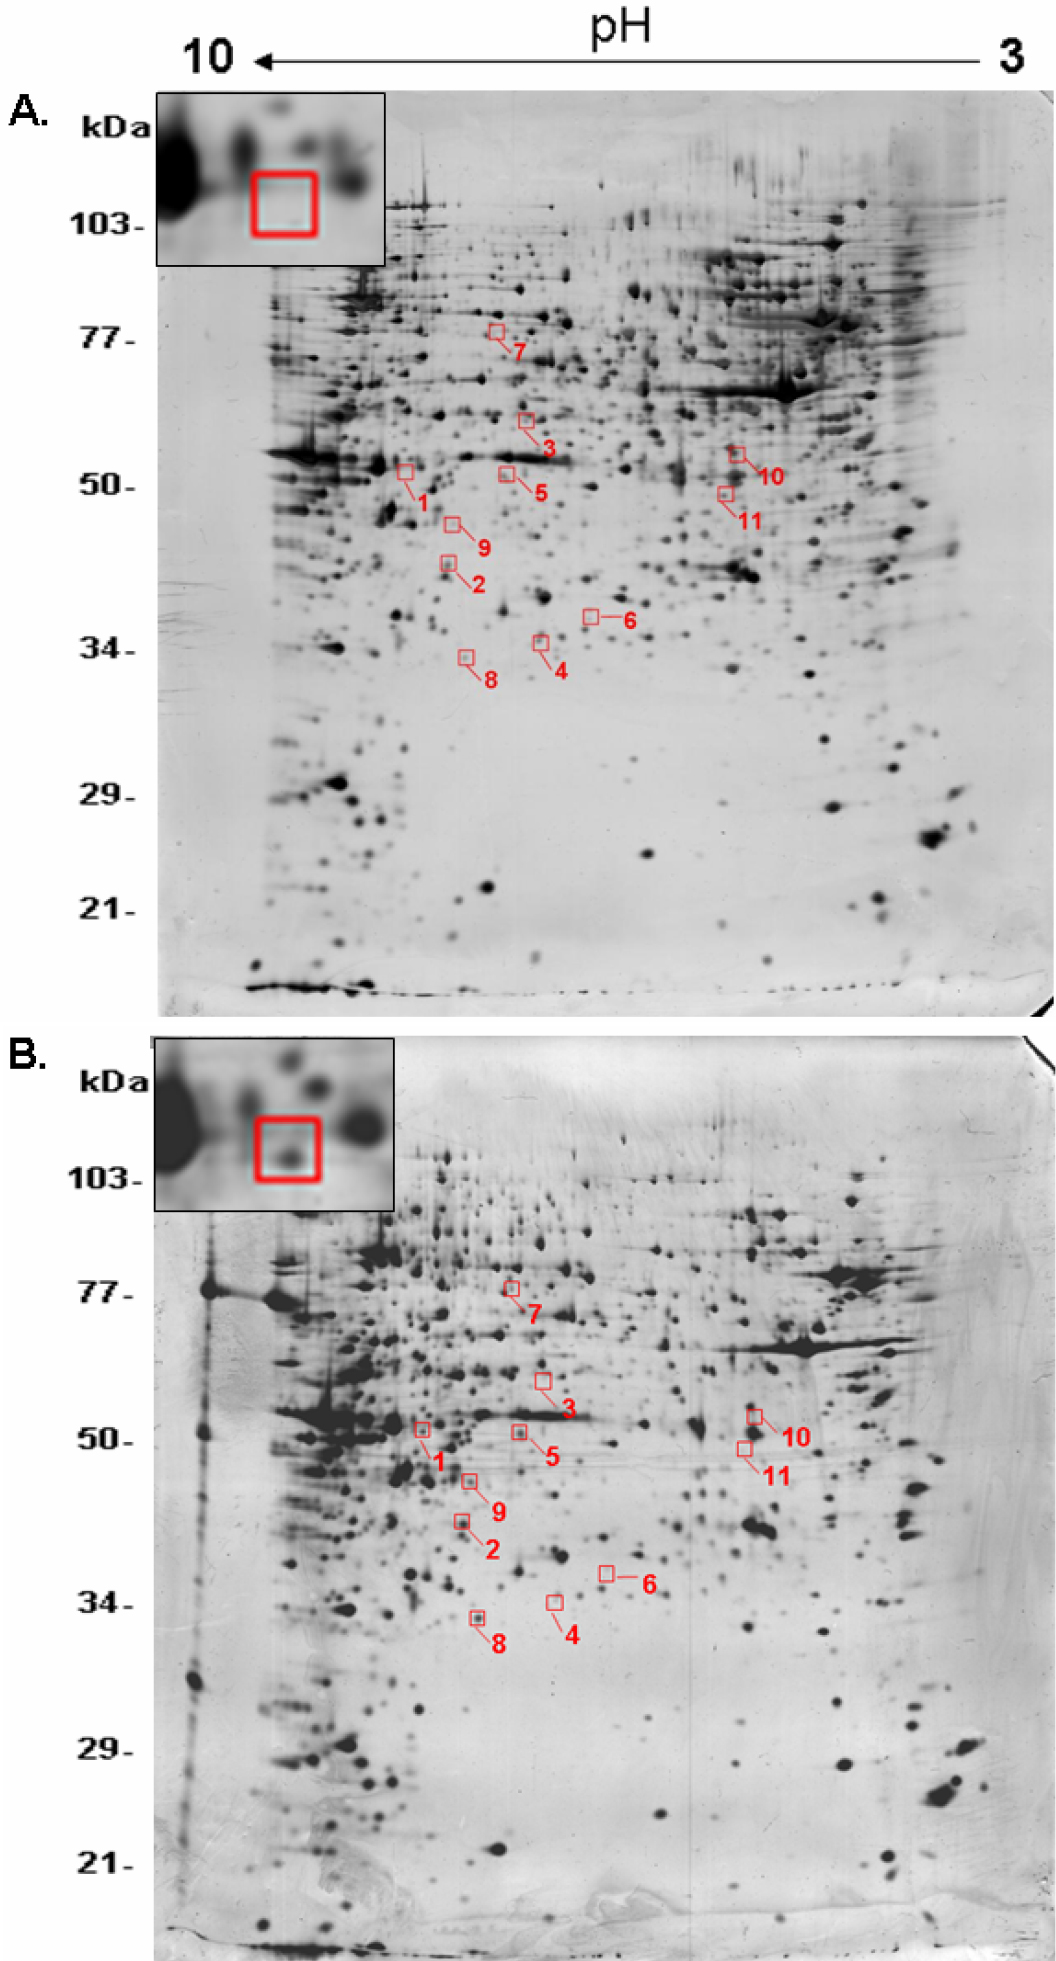
Figure 2. Two-dimensional electrophoresis
comparison between NTM and GTM membrane protein extracts.
Silver-stained 2D gels of membrane protein extracts from NTM (A)
and GTM (B) are shown. Differentially abundant protein spots are
highlighted in the red frames. Spot 1 was identified as copine1 (MW
58.6 kDa, pI 6.43). The expanded regions of differentially expressed
copine1 were cut from the representative gels and pasted in the top
left corner of the image. NTM: normal TM cells; GTM: glaucomatous TM
cells.