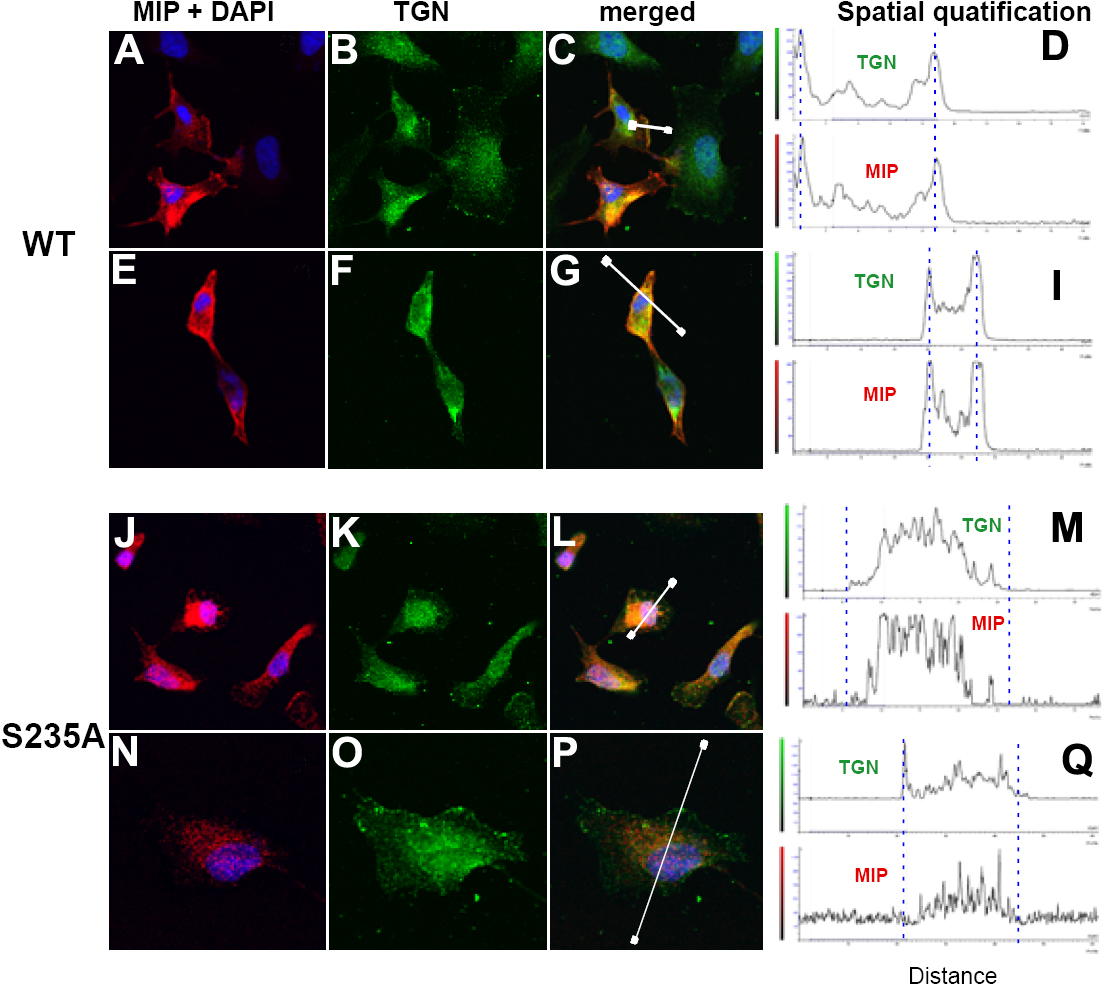
Figure 4. Mutation of PKC putative
phosphorylation site (Ser235) prevents MIP translocation
from the trans-Golgi network to the plasma membrane. Immunofluorescence
of RK13 cells transfected with pCMV- MIP (WT; A-I) or
pCMV-MIP Ala235 (S235A; J-Q) for 72 h is
shown. A and E as well as J and N show
the merged images of MIP red immunofluorescence with the corresponding
images of their DAPI nuclear staining. B and F as well
as K and O show the trans-Golgi network marker 38K
(TGN) green immunofluorescence. C, G, L, and P show the
merged images of MIP immunofluorescence and DAPI nuclear staining with
their respective TGN green immunofluorescence (A and B; E
and F; J and K; N and O,
respectively). Spatial quantification was performed along a path across
the plasma membrane, indicated by a white line with prominent end
points in the merged images (C, G, L, and P).
Red and green fluorescence was quantified separately and plotted as a
function of distance along the path (D, I, M,
and Q). Blue broken lines in the spatial quantification graphs
indicate the approximate location of the plasma membrane (except the
left line in D, which corresponds to the TGN region in C).
Note that WT MIP and TGN vesicles colocalize at the plasma membrane
(peaks are indicated with blue lines in I and right peak in D).
MIP Ala235 mutant (S235A) does not colocalize with TGN
vesicles at the plasma membrane (blue lines; M and Q). C
and G show colocalization (yellow) of WT MIP (red
immunofluorescence) and TGN 38K (green immunofluorescence) in the
cytoplasmic compartment in addition to the localization of WT MIP in
the plasma membrane. J and N show MIP Ala235
mutant punctate distribution in the cytosolic compartment (red
immunofluorescence) and colocalization (yellow) with trans-Golgi
network 38K (green) in L and P. A and E
as well as J and N show cell images from either
duplicate experiments or in different fields of the same cell culture
of WT or MIP Ala235 mutant (S235A), respectively. Scale bars
represent 10 μm. Note that three cells in A, B, and C
(one cell at the right side and two cells in the upper part of the
panels) that did not uptake the transfected MIP expression plasmid
served as negative controls. They show no red immunofluorescence in
contrast to two transfected cells showing the red immunofluorescence.
All the cells in the panel (transfected and non-transfected) show green
immunofluorescence for TGN38.