Figure 2 of Golestaneh, Mol Vis 2008; 14:1006-1014.


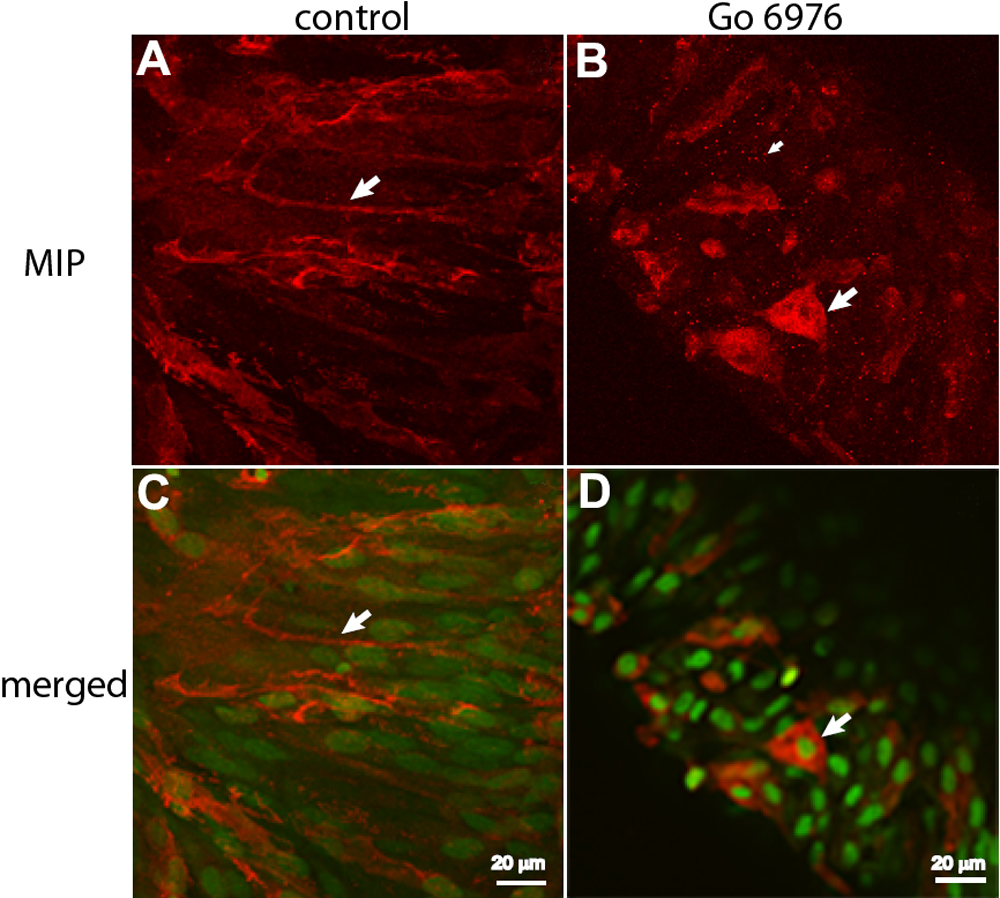
Figure 2. PKC inhibitor prevents MIP membrane localization in differentiating lens explants. MIP immunofluorescence (red) shows MIP localization in the cell membrane (A,C; indicated with large arrows) of rat lens epithelial explants cultured in 100 ng/ml FGF-2 and 0.2% DMSO for 72 h (control; as described in Methods; A and C). MIP is retained in the cytosolic compartment (B,D; large arrows point to cell with strong MIP signal in the cytoplasmic compartment; numerous MIP-positive vesicles were also seen, small arrow) in rat lens epithelial explants cultured for 72 h (100 ng/ml FGF-2 in the presence of 4 μM Go6976 plus 0.2% DMSO as described in Methods; panels B and D). C and D show the merged images of MIP immunofluorescence (A and B, respectively) with the ones for green nuclei staining. Green fluorescence indicates nuclei stained with SYTOX green dye. Scale bars represent 20 μm. C and D show one of the z stack confocal images of MIP immunofluorescence cell distribution through the thickness of the cultured explant in the control (animation 1, left) and Go6976 (animation 2, right) experiments, respectively. Note that the slide bar at the bottom of the quicktime movie can be used to manually control the flow of the movie. If you are unable to view the movie, a representative frame is included.

Note that the slide bar at the bottom of the quicktime movie can be used to manually control the flow of the movie. If you are unable to view the movie, a representative frame for each movie is included below (C and D).

This animation requires Quicktime 6 or later.
Quicktime is available as a free download.