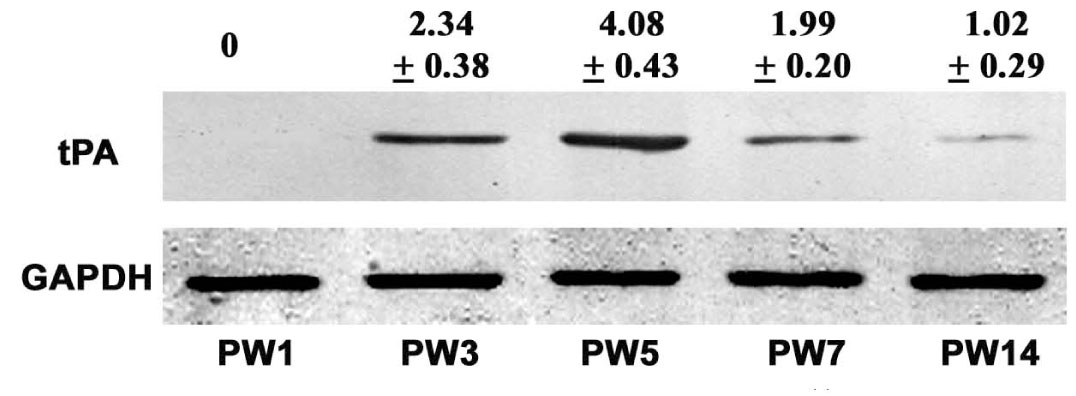
Figure 3. Western blotting for tissue
plasminogen activator (tPA) expression in the visual cortex during
post-natal development. tPA has a molecular weight corresponding to 67
kDa. The staining protocol was optimized to produce a single distinct
band. Data at the top of the bands shows the
tPA/glyceraldehyde-3-phosphate dehydrogenase (GAPDH) ratio (%) at each
age (mean±SD, n=10). Microdensitometry revealed that tPA is not
expressed at PW1 but is present at all other ages sampled. Comparisons
were made using a least significant difference (LSD) multiple
comparison t-test. tPA reaches its highest expression at PW5
and then declines. Protein expression at PW3, PW7, and PW5 was
significantly higher than at PW14 (p<0.05 and 0.01 respectively).
The peak value at PW5 was significantly higher than that seen at PW3
and PW7 (p<0.05).