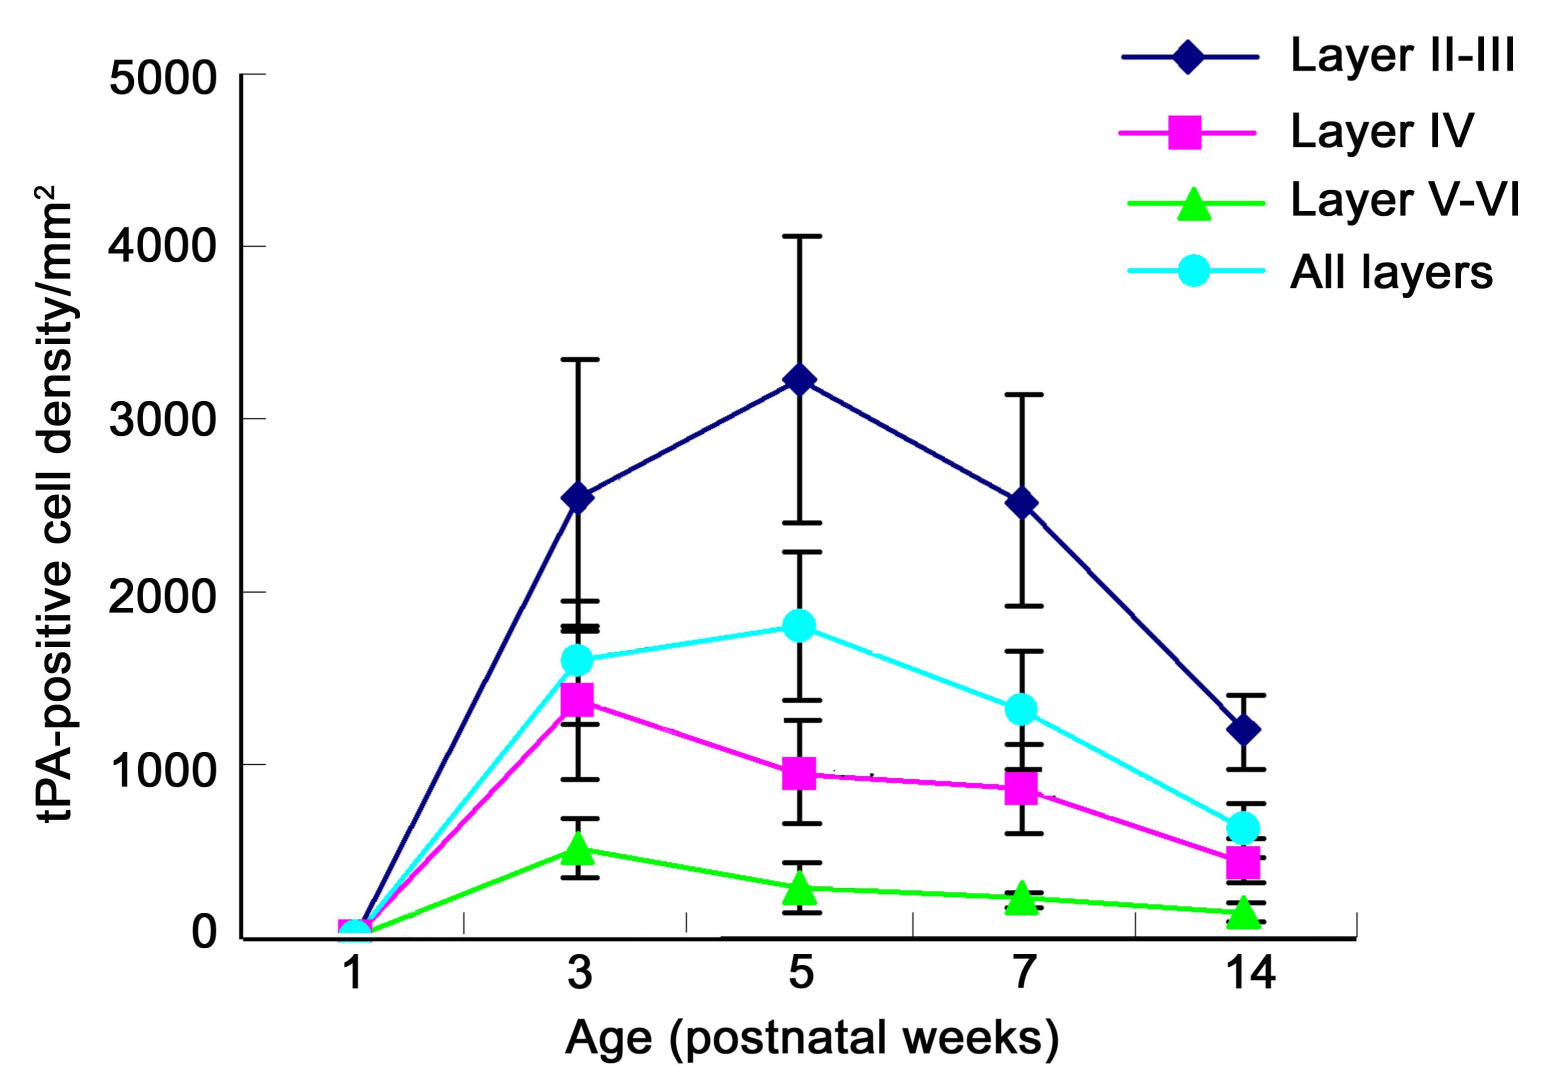
Figure 2. Distribution and profile of
tissue plasminogen activator (tPA)-positive cell density in visual
cortex during post-natal development. tPA was visualized with a
fluorescein isothiocyanate (FITC)-conjugated secondary antibody and the
number of cells within each layer counted (data points represent the
mean±SD, n=9). Data was compared using a least significant
difference-(LSD) multiple comparison t-test. tPA labeling is
prominent in layer II-III and layer IV. Comparisons between layers
showed that labeled cell density in layer II-III was significantly
higher than layer IV and V-VI (p<0.01) and cells density in layer IV
was higher than that in layer V-VI (p<0.05). Within layer II-III,
tPA labeled cell density reaches a maximum at PW5, and then declines,
such that the following cell density comparisons were significant; PW3
versus PW5 and PW14 (p<0.05, 0.01, respectively), PW5 versus PW7 and
PW14 (p<0.05, 0.01, respectively), and PW7 versus PW14 (p<0.01),
respectively. Note that in layer IV the density of tPA labeled cells
reaches a maximum at PW3 that is significantly higher than values at
PW5, PW7, and PW14 (p<0.01), similarly values at PW5 and PW7 are
higher than at PW14 (p<0.01). The same trend was seen within layer
V-VI and labeled cell density at PW3 significantly higher than at later
ages (p<0.01). The density of tPA-containing cells across the whole
thickness of the visual cortex reaches a maximum at PW5 and declines
significantly to lower densities at PW7 before reaching a minimum at
post-natal PW14 (PW14 versus PW3, PW5, and PW7, p<0.01). Cell
density at PW5 was significantly higher than that at PW7 (p<0.05).