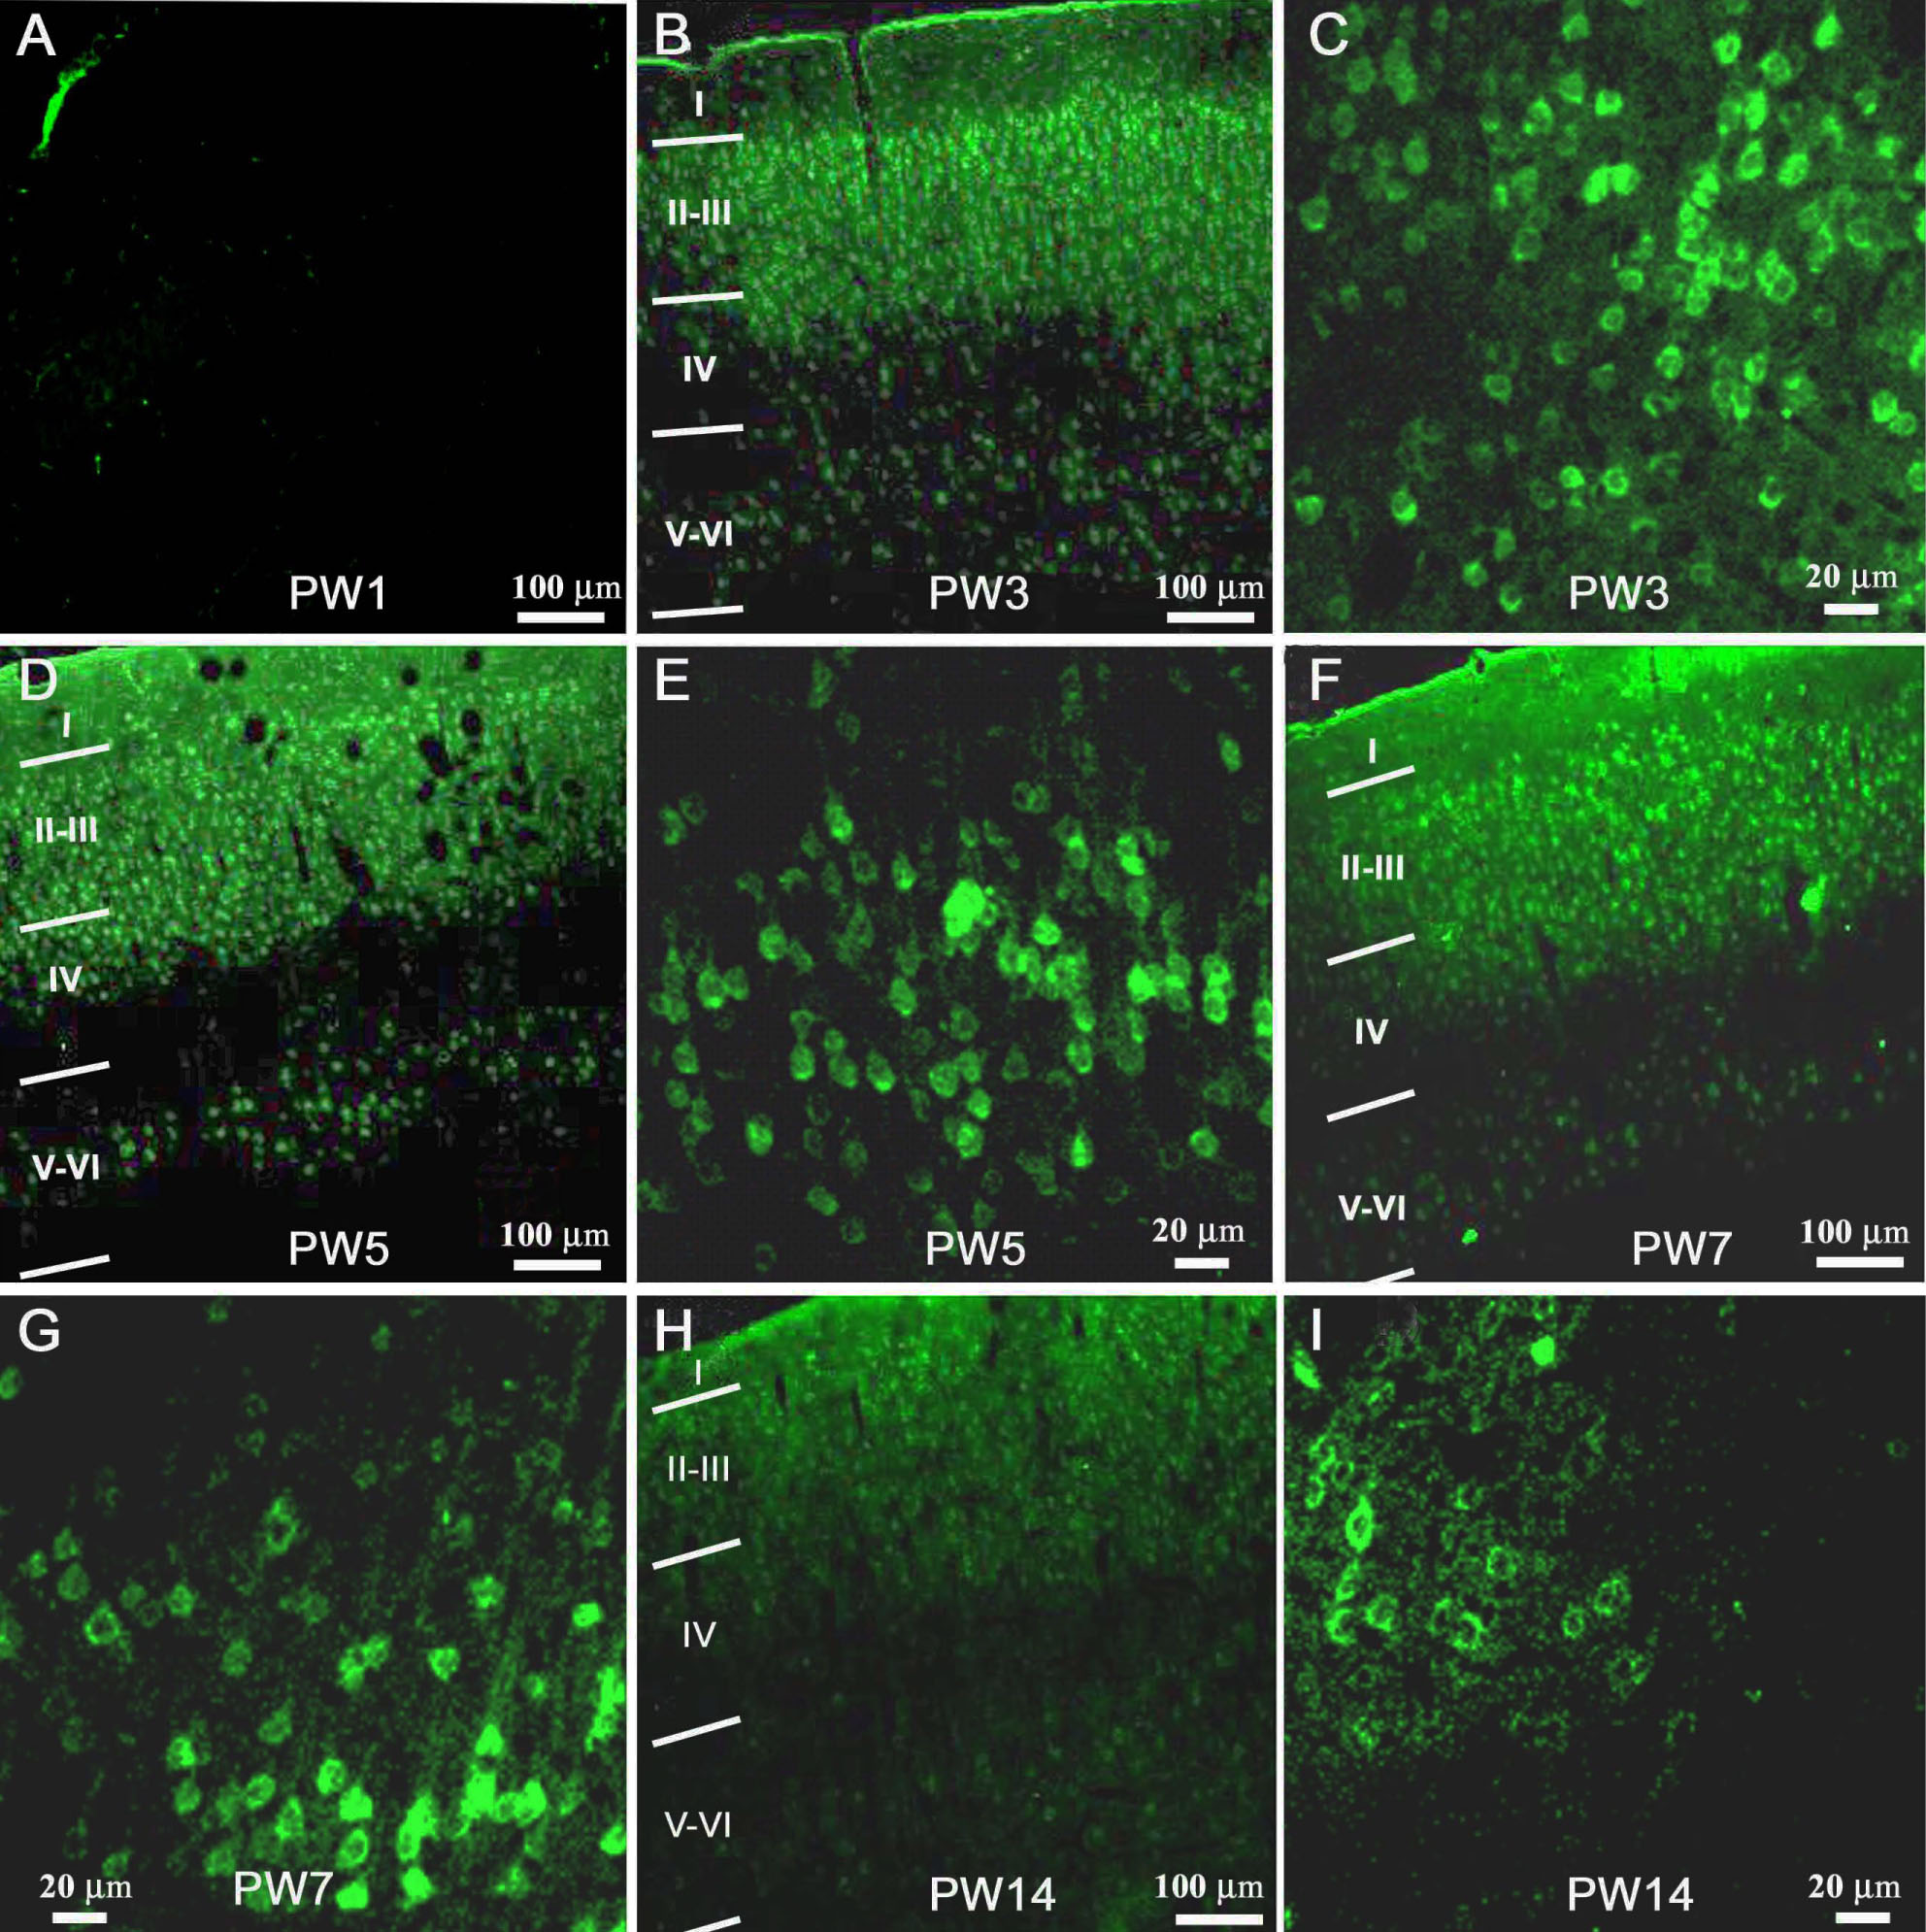
Figure 1. Tissue plasminogen activator
immunoreactivity in the visual cortex of the Long Evans rat. A,
B, D, F, and H: Low magnification
photomicrographs shows the visual cortices of rats aged postnatal week
1 (PW1), PW3, PW5, PW7, and PW14, respectively. Photomicrographs were
taken in the transitional region between monocular and binocular visual
cortex. Note that no tissue plasminogen activator (tPA) is stained in
the visual cortex at PW1 (A), although tPA-positive cells are
prominent in layer II-III at later ages. C, E, G,
and I: Higher magnification photomicrographs shows tPA staining
in layer V-VI at the same ages. Note the faint apical dendritic
labeling seen at PW3, PW5, and PW7. The scale bar in A
represents 100 μm and also refers to B, D, F,
and H; the scale bar in C represents 20 μm and also
refers to E, G and I.