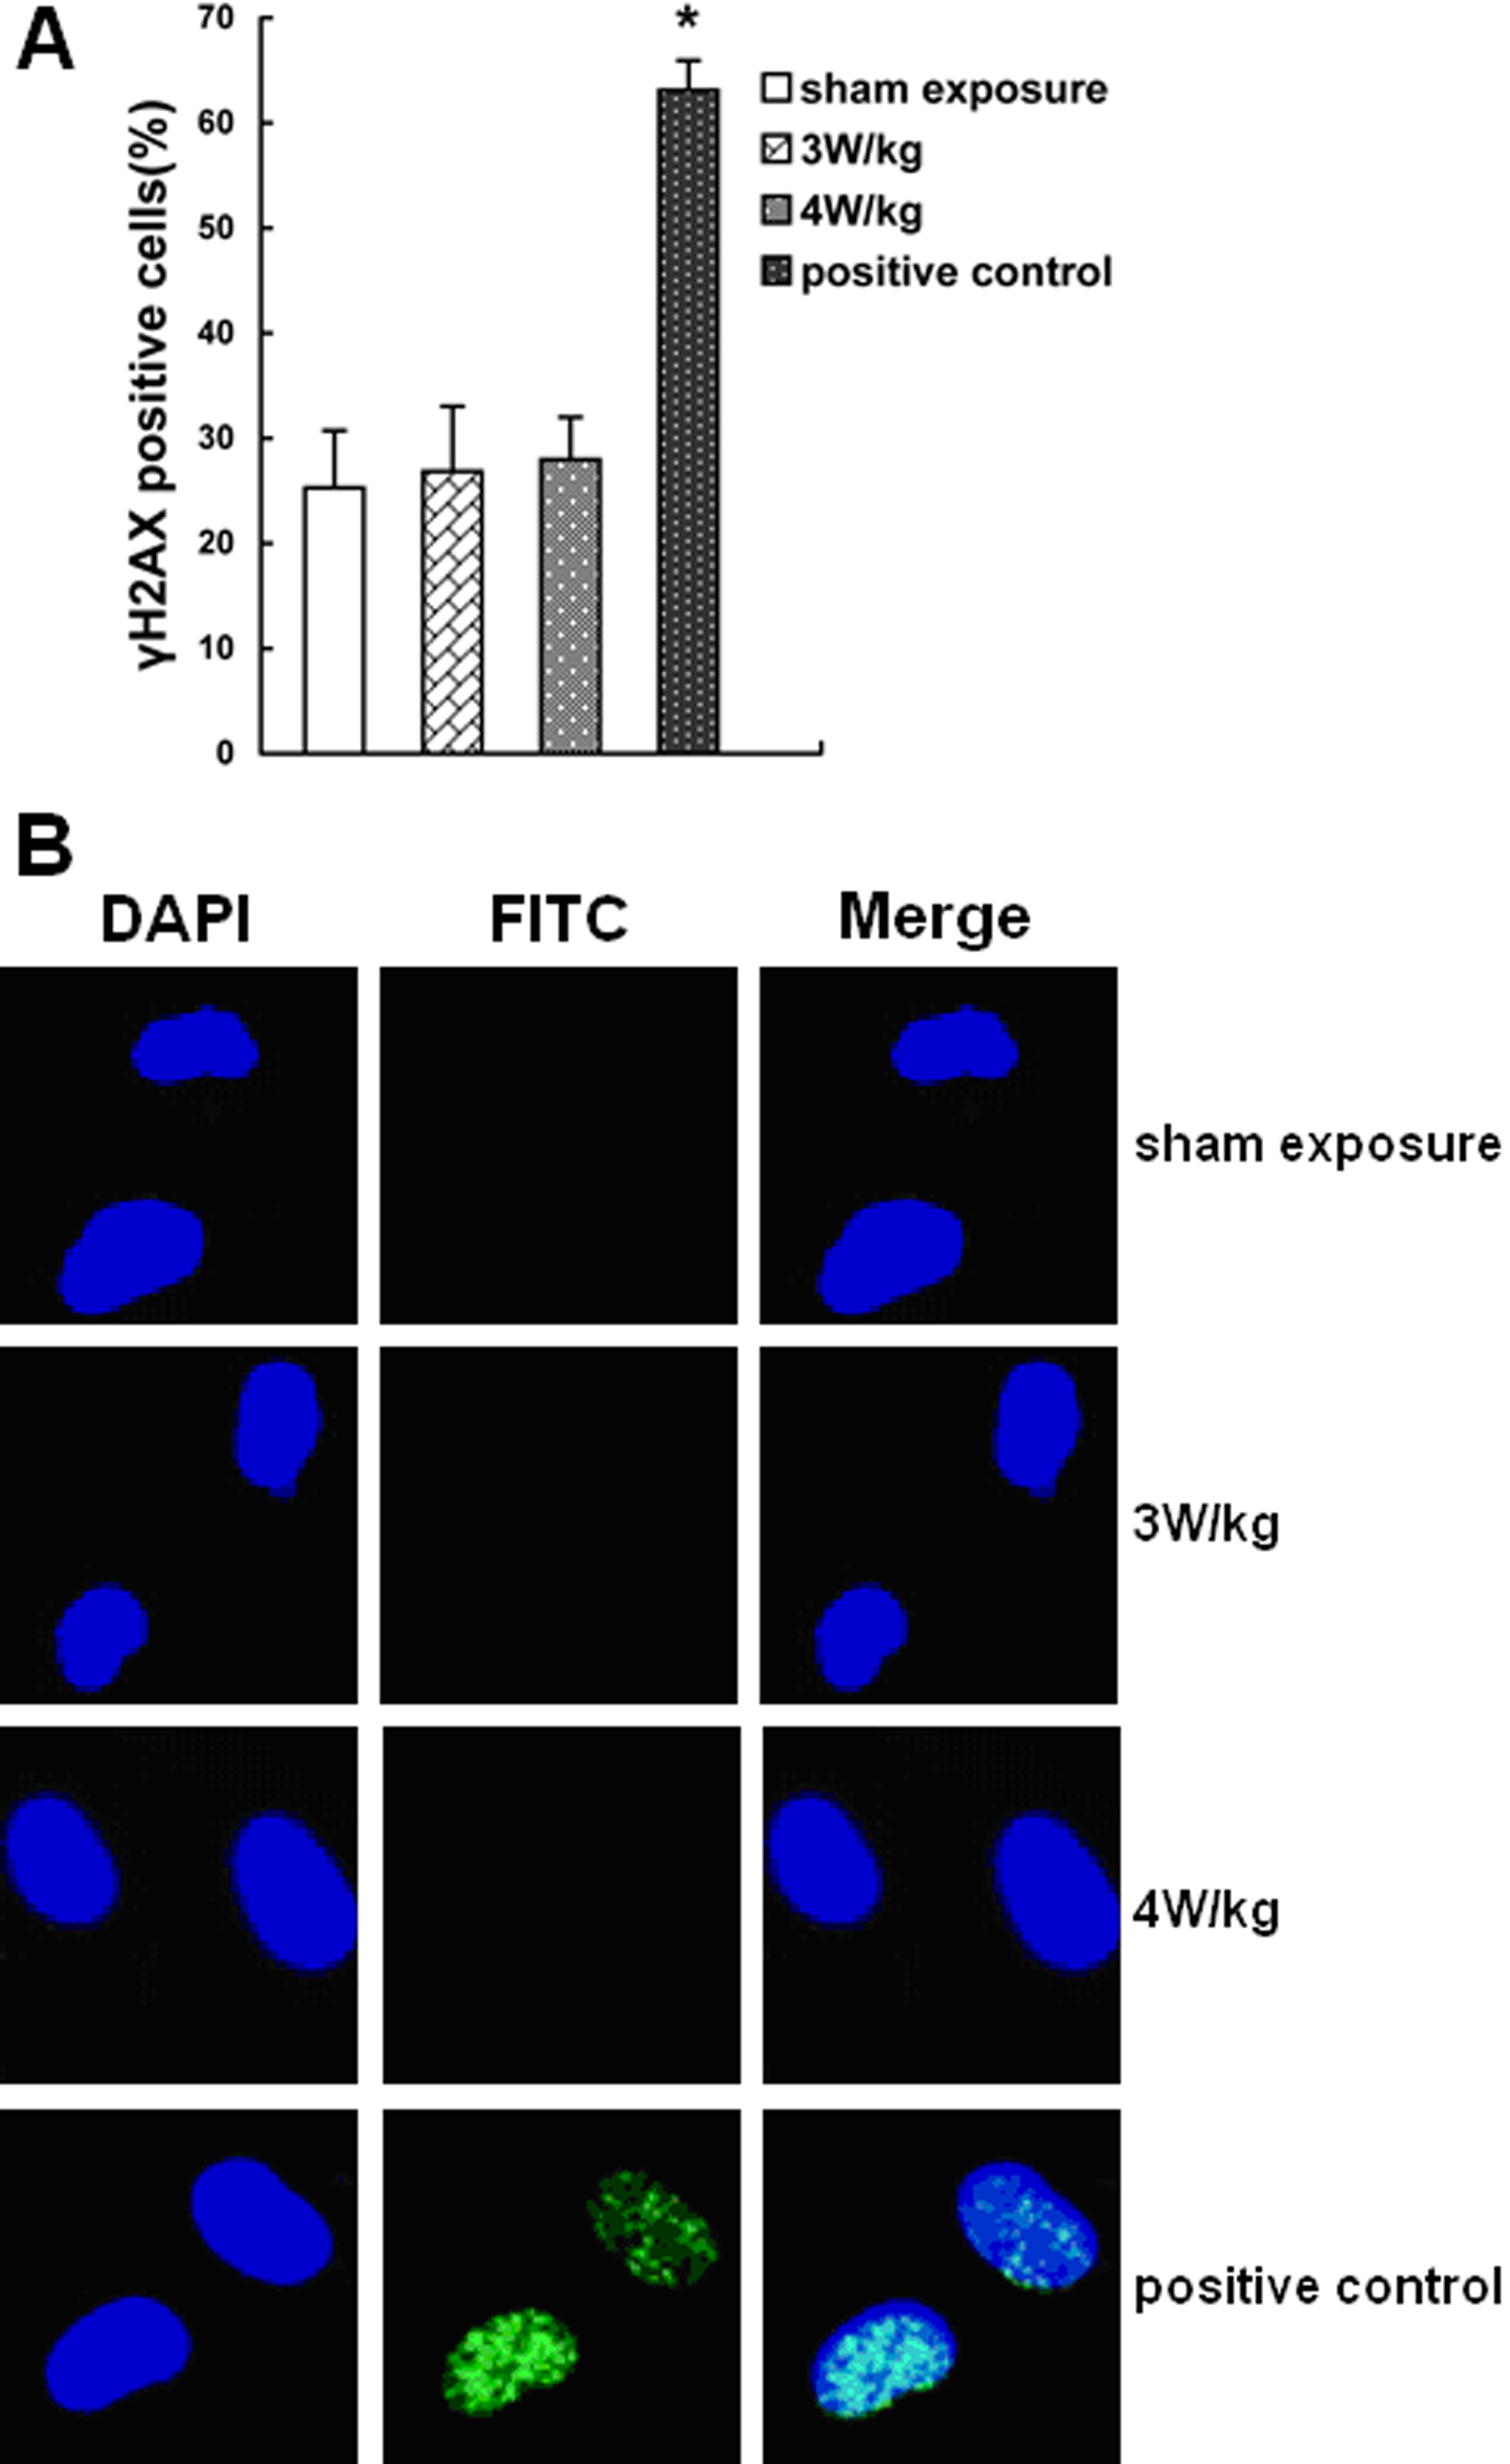
Figure 3. The results of γH2AX foci
formation assay after 1.8 GHz microwave treatment. A: The
percentage of γH2AX positive cells is shown. No significant changes of
DSBs were detected after exposure to the 3 W/kg and 4 W/kg radiation. B:
Images of γH2AX foci is shown. The nuclei stained by DAPI exhibit in
blue, while the DSBs stained by FITC exhibit in green. The asterisk
indicates that p<0.001