Figure 3 of
Miyai, Mol Vis 2008; 14:942-950.
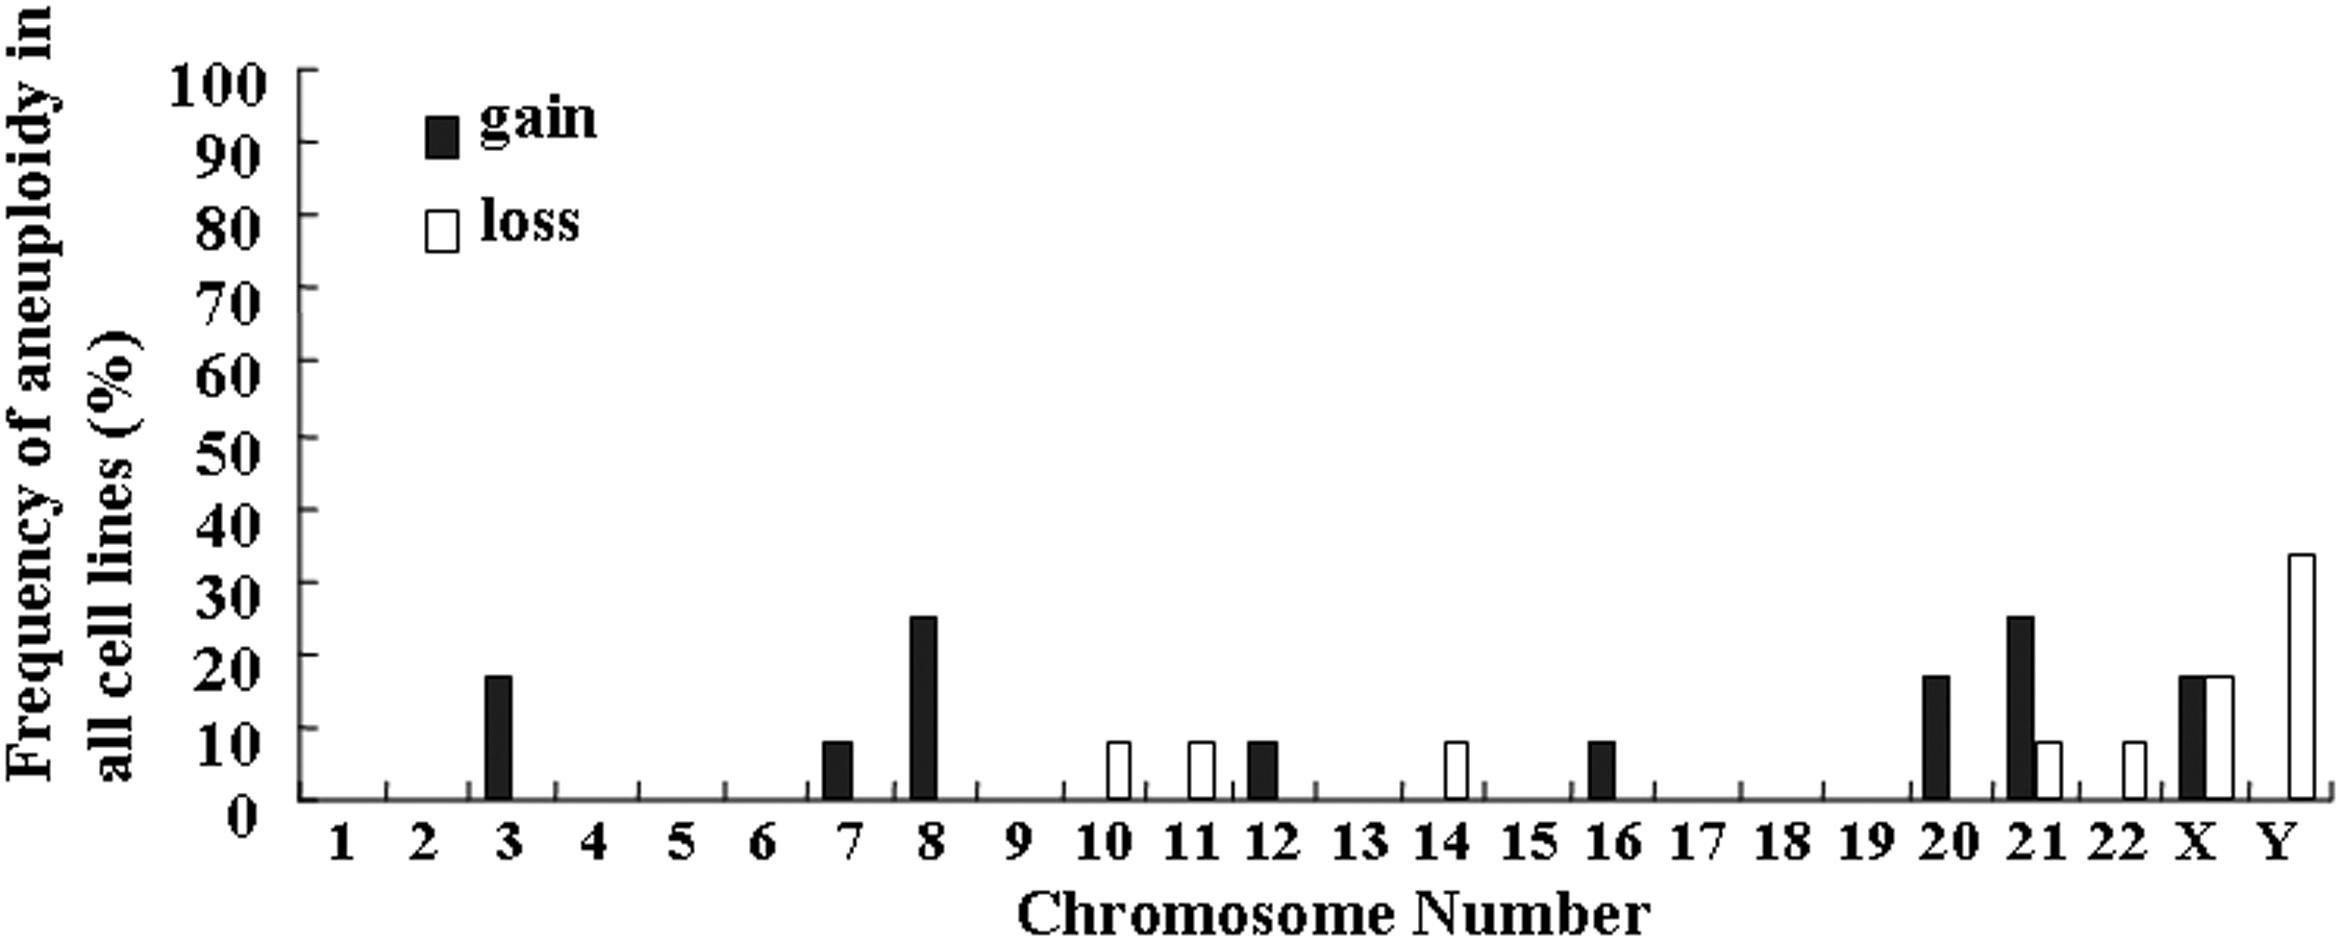
Figure 3.
Distribution of chromosome aneuploidy in cultured human corneal endothelial cells at third passage. The frequency of gain or loss of each chromosome is shown.