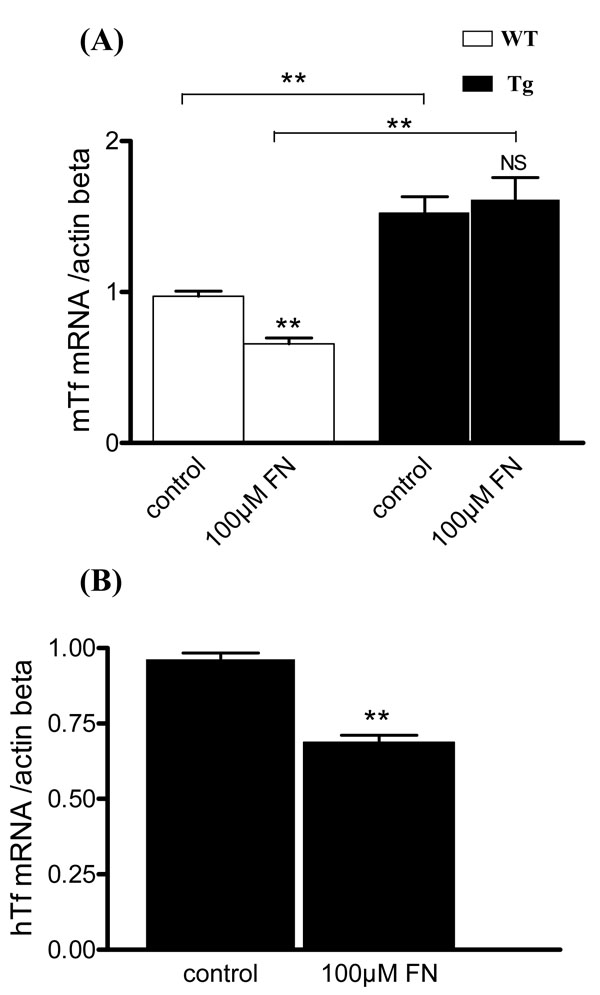
Figure 7. Mouse transferrin and human
transferrin mRNA expression are modified after iron stress. A:
Mouse transferrin (mTf) mRNA expression was quantified by
RT-qPCR in Müller glial (MG) cells respectively from wild-type
(WT) and transgenic (Tg) mice in control condition and after addition
of 100 µM FeCl3-NTA (FN) in the medium during 96 h. Each
column represents the mean ± SEM. The double asterisk represents
statistical significance of differences between treated and
control, respectively, for WT and Tg, and between control and treated,
p<0.01. B: Human transferrin (hTf) mRNA expression was quantified by
RT-qPCR in MG cells, respectively, from Tg mice in control
condition and after addition of 100 µM FN in the medium during 96
h. Each column represents the mean ±SEM. The double asterisk represents
statistical significance of differences from control,
p<0.01 In both figures, data considered not significant is marked NS.