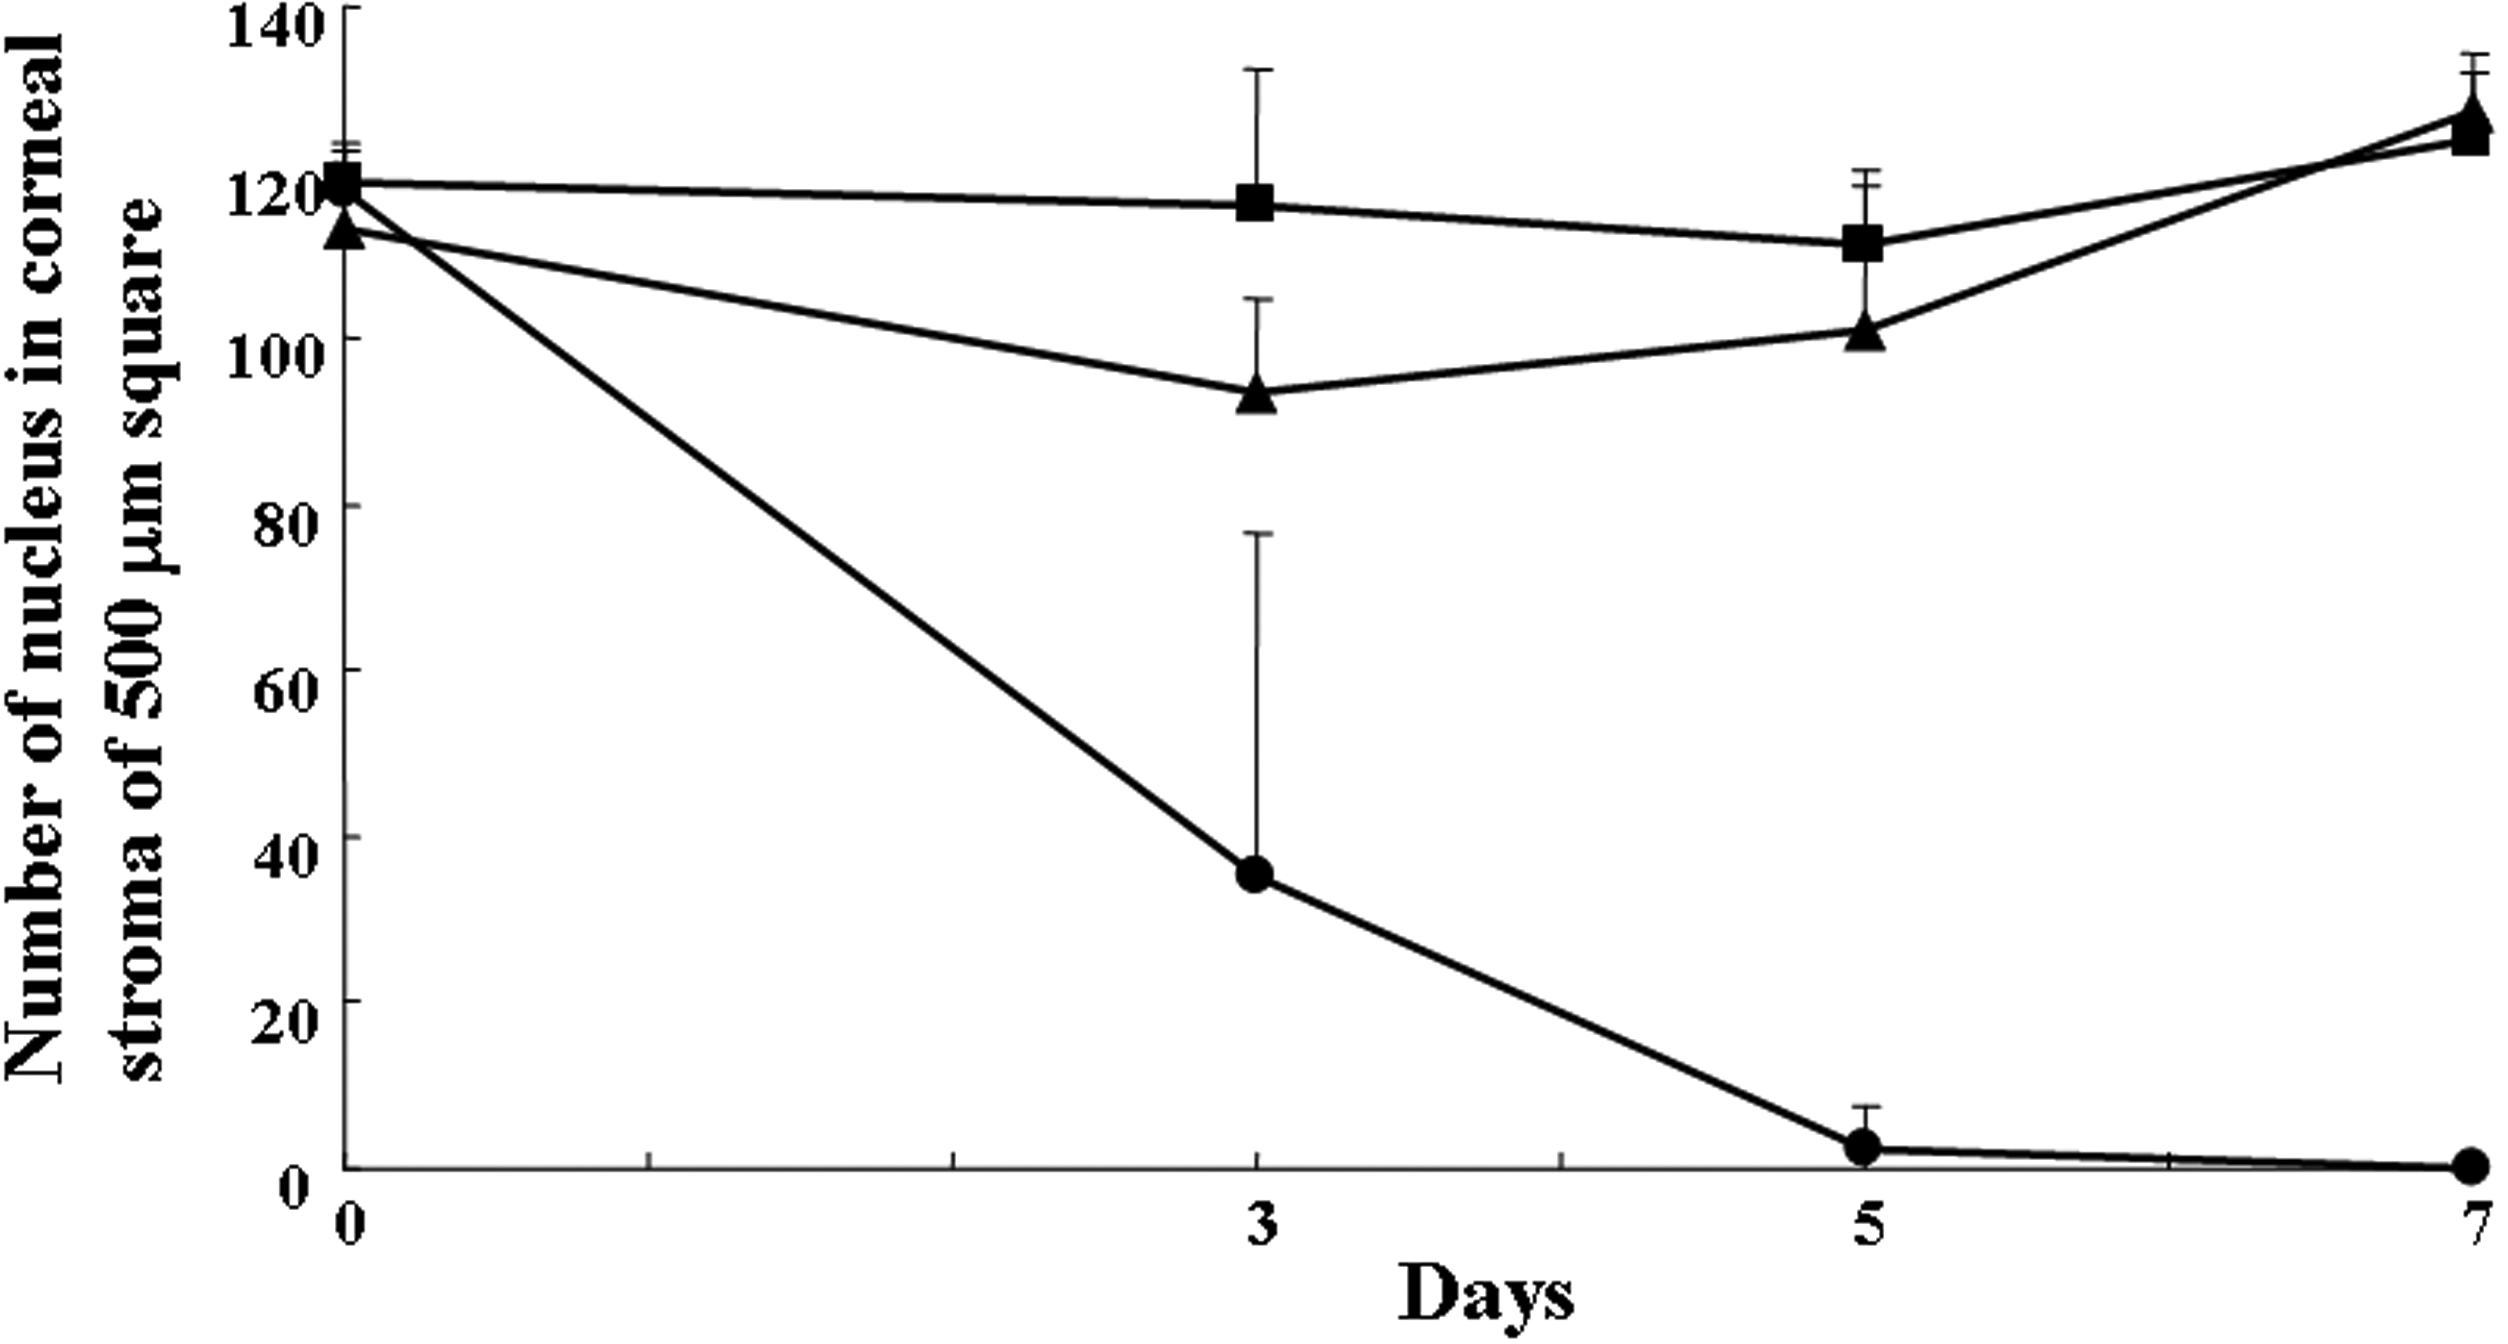
Figure 2. Temporal changes in the number
of cellular nuclei in the N2 group and the control groups.
The temporal changes in the number of cellular nuclei stained with
Hoechst 33342 in a 500 μm2 area of the central corneal
stroma in the N2 group (closed circles), control group 1
(closed squares), and control group 2 (closed triangles) is shown in
this chart. Significantly fewer stained cellular nuclei were observed
in the corneal stroma of the N2 group than in the control
groups on day 3 (p=0.0054), 5 (p<0.0001), and 7 (p<0.0001).