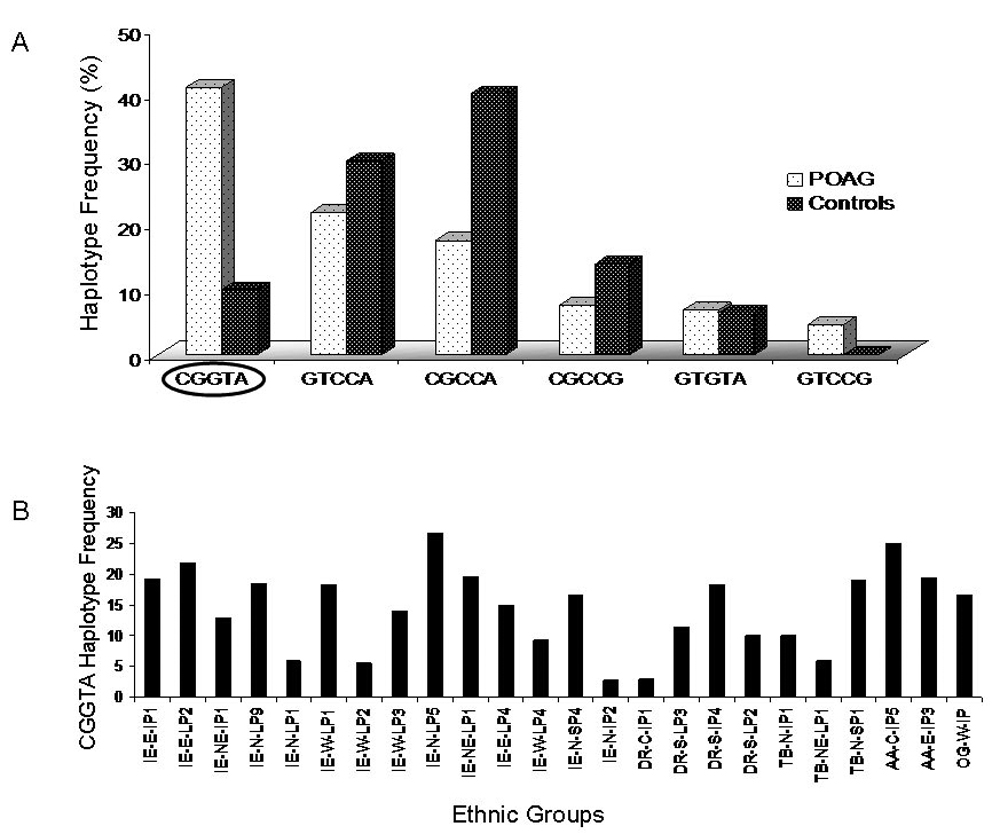
Figure 5. CYP1B1 haplotype
distribution. A: CYP1B1 haplotype variation among
primary open-angle glaucoma patients and controls The Study of
haplotype diversity among patients and controls revealed C-G-G-T-A as
the predominant haplotype among POAG patients (41%) and a lower
representation among controls (10%). Hence, the haplotype represents a
potential risk haplotype among POAG patients. B: The
distribution of the risk haplotype (CGGTA) in 24 ethnic groups of the
Indian population. The study on the distribution of the risk haplotype
(C-G-G-T-A) in the various ethnic groups of the Indian population
revealed the highest frequency (26.6%) among the ethnic group,
IE-N-LP5, followed by AA-C-IP5 (25%). In the OG-W-LP5 group where
c.1666G (Val432) is the major allele, the risk haplotype frequency was
estimated to be 16.7%.