![]() Figure 3 of
Papanikolopoulou, Mol Vis 2008;
14:81-89.
Figure 3 of
Papanikolopoulou, Mol Vis 2008;
14:81-89.
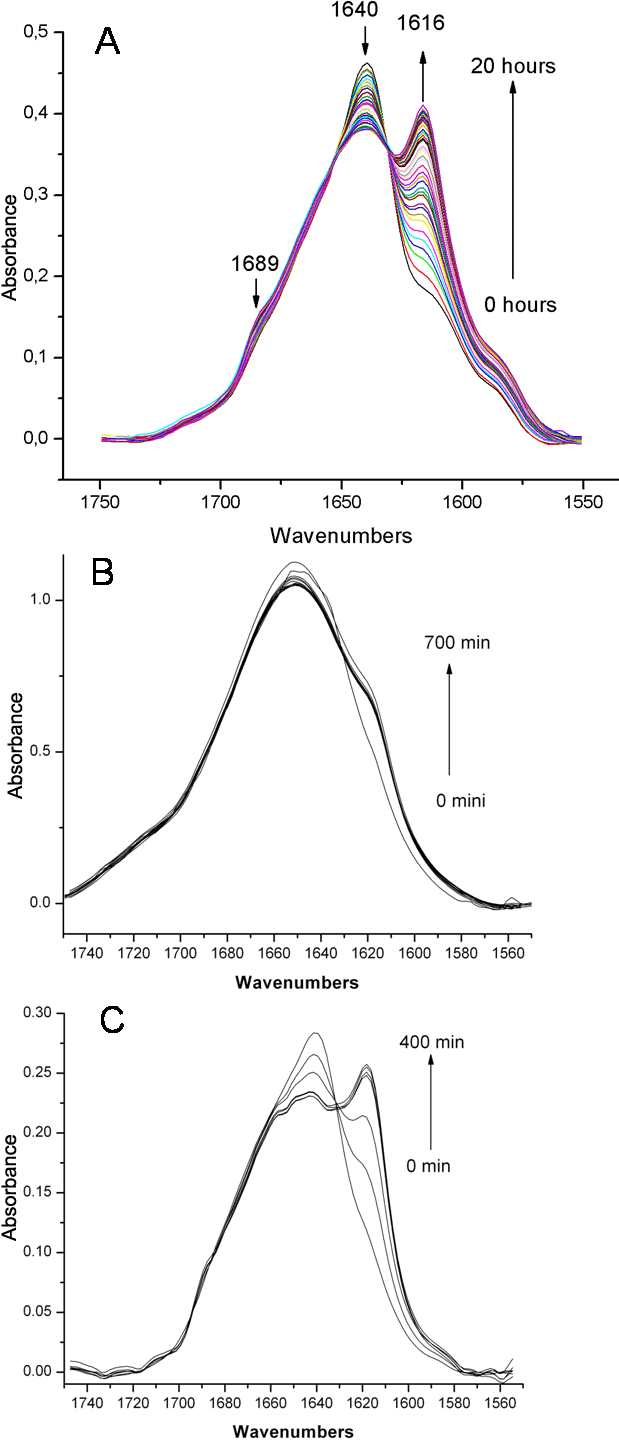
Figure 3. FTIR spectra as a function of incubation time from 0 to 20 h, at low pH, 37 °C
A: HγD-Crys, B: HγD-Crys Ctd, and C: HγD-Crys Ntd. The spectral shift associated with fibril formation is indicative of an increase in the extent of antiparallel β-sheet content.