![]() Figure 6 of
Hitani, Mol Vis 2008;
14:1-9.
Figure 6 of
Hitani, Mol Vis 2008;
14:1-9.
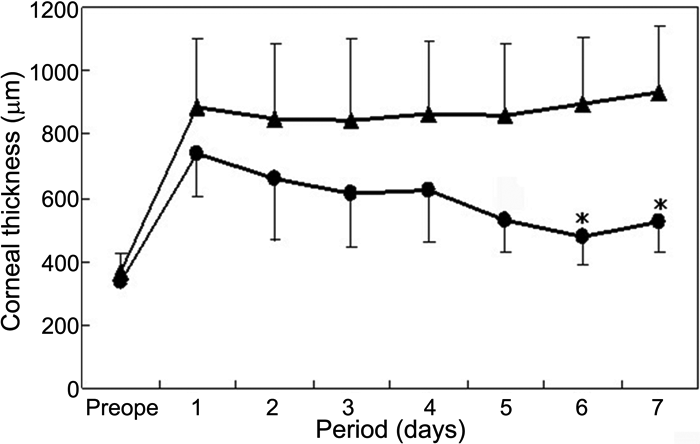
Figure 6. Time-course of average central corneal thickness after human corneal endothelial cell sheet transplantation
Average central corneal thicknesses in the HCEC sheet group (circle) and control group (triangle). In the control group, the mean corneal thickness remained over 800 μm throughout the one-week observation. In contrast, the mean corneal thickness rapidly decreased in the HCEC sheet group, and was significantly less than that in the control group at days 6 and 7.
